With the arrival of April showers, Spring has officially "sprung", and the world around us will quickly start to turn a lush green.
This time of year typically marks a significant uptick in activity within the real estate market. However, this year's potential homebuyers seem to be more tentative in their approach, even though the number of visitors attending Open Houses has spiked considerably. This hesitancy is reflected in the Housing Price Index, with many markets experiencing small dips in value – a highly unusual trend for a March market.
As with any dataset, it is crucial to consider the size of the sample before drawing definitive conclusions. While these price changes are noteworthy, it is important to bear in mind that they are based on a relatively small number of sales. Nonetheless, it will be interesting to observe how the real estate market continues to evolve over the upcoming months.
As with any dataset, it is crucial to consider the size of the sample before drawing definitive conclusions. While these price changes are noteworthy, it is important to bear in mind that they are based on a relatively small number of sales. Nonetheless, it will be interesting to observe how the real estate market continues to evolve over the upcoming months.
REBGV: SPRING BRINGS RENEWED PRICE GROWTH ACROSS METRO VANCOUVER’S HOUSING MARKET WHILE NEW LISTINGS REMAIN DORMANT
Home prices across Metro Vancouver’s housing market showed modest increases in March, while new listings remained below long-term historical averages. March data also indicates home sales are making a stronger than expected spring showing so far, despite elevated borrowing costs.
The MLS® Home Price Index composite benchmark price for all residential properties in Metro Vancouver is currently $1,143,900. This represents a 9.5% decrease over March 2022 and a 1.8% increase compared to February 2023.
“On the pricing side, the spring market is already on track to outpace our 2023 forecast, which anticipated modest price increases of about 1 to 2% across all product types,” Andrew Lis, REBGV’s director of economics and data analytics said. “The surprising part of this recent activity is that these price increases are occurring against a backdrop of elevated borrowing costs, below-average sales, and new listing activity that continues to suggest that sellers are awaiting more favorable market conditions.”
“If home sellers remain on the sidelines, monthly MLS® sales figures will continue to appear lower than historical averages as we move toward summer,” Lis said. “But it’s important to recognize the chicken-and-egg nature of these statistics. The number of sales in any given month is partially determined by the number of homes that come to market that month, along with the inventory of unsold homes listed in previous months. With fewer homes coming on the market, homes sales will remain lower than we’re accustomed to seeing at this point in the year, almost entirely by definition.”
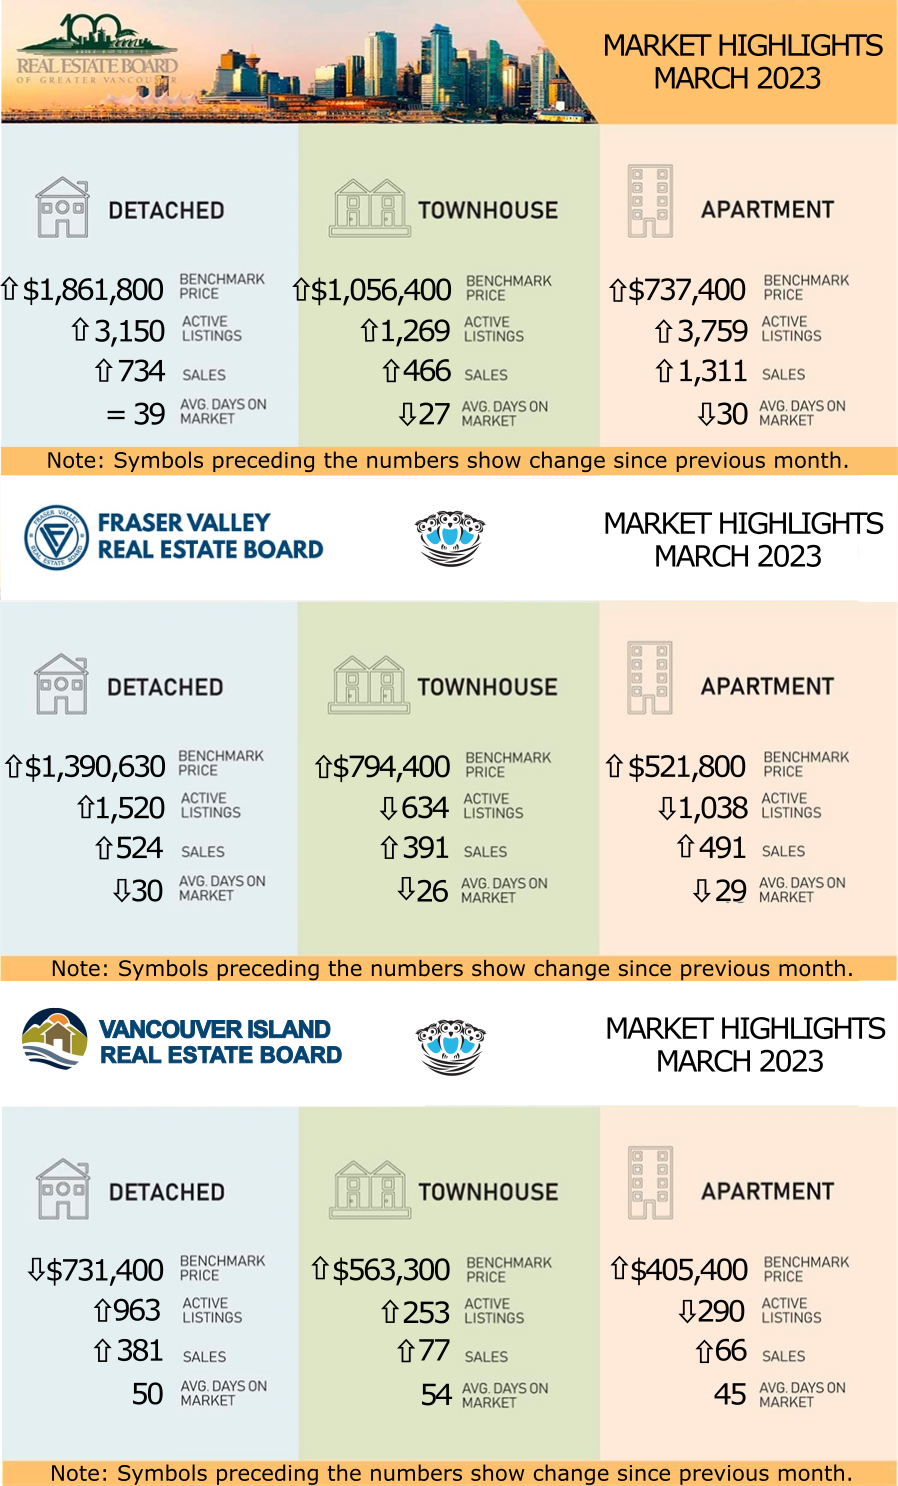
The benchmark price for detached properties is $1,861,800. This represents an 11.2% decrease from March 2022 and a 2.7% increase compared to February 2023.
Home prices across Metro Vancouver’s housing market showed modest increases in March, while new listings remained below long-term historical averages. March data also indicates home sales are making a stronger than expected spring showing so far, despite elevated borrowing costs.
The MLS® Home Price Index composite benchmark price for all residential properties in Metro Vancouver is currently $1,143,900. This represents a 9.5% decrease over March 2022 and a 1.8% increase compared to February 2023.
“On the pricing side, the spring market is already on track to outpace our 2023 forecast, which anticipated modest price increases of about 1 to 2% across all product types,” Andrew Lis, REBGV’s director of economics and data analytics said. “The surprising part of this recent activity is that these price increases are occurring against a backdrop of elevated borrowing costs, below-average sales, and new listing activity that continues to suggest that sellers are awaiting more favorable market conditions.”
“If home sellers remain on the sidelines, monthly MLS® sales figures will continue to appear lower than historical averages as we move toward summer,” Lis said. “But it’s important to recognize the chicken-and-egg nature of these statistics. The number of sales in any given month is partially determined by the number of homes that come to market that month, along with the inventory of unsold homes listed in previous months. With fewer homes coming on the market, homes sales will remain lower than we’re accustomed to seeing at this point in the year, almost entirely by definition.”
The benchmark price for detached properties is $1,861,800. This represents an 11.2% decrease from March 2022 and a 2.7% increase compared to February 2023.
The benchmark price of an apartment property is $737,400. This represents a 4.6% drop from March 2022 and a 0.7% increase compared to February 2023.
The benchmark price of an attached unit is $1,056,400. This represents a 7.8% decrease from last year and a 1.7% increase compared to February 2023.
LINK to the March 2023 REBGV statistics.
FVREB: MOMENTUM CONTINUES TO BUILD IN THE FRASER VALLEY REAL ESTATE MARKET
March 2023 saw the second consecutive month of growth in sales in the Fraser Valley, and although still below seasonal norms, the trend is an encouraging sign that the region continues to head towards increased market stability.
“After months of uncertainty made it difficult for buyers and sellers to re-enter the housing market, we may well be seeing a turning point,” said Narinder Bains, Chair of the Fraser Valley Real Estate Board. “The pause in rate hikes has helped to restore a much-needed sense of predictability, which is building consumer confidence. As a result, we’re starting to see more traffic at open houses along with more multiple offer situations.”
As in all regions across the province and the country, low supply is still an issue and a primary factor driving price growth. As a result, the aggregate sales-to-active listings ratio grew to 34%, shifting the market into sellers territory, with demand for townhomes even more pronounced, at a 62% ratio. (The market is considered balanced when the sales-to active listings ratio is between 12% and 20%.)
“While market demand continues to trend up, we still face an uphill battle on the supply side, which is keeping prices elevated,” said FVREB CEO, Baldev Gill. “The province will require sustained inventory growth of at least 25% over each of the next five years in order to normalize inventories.”
VIREB: HOUSING MARKET BRISKER THAN EXPECTED IN MARCH
“Sales were lower last month than at this time last year, but 2022 was an unusually robust year for the housing market,” says Kelly O’Dywer, 2023 Chair. “That said, March was surprisingly busy for many REALTORS®, and we’re seeing a lot of optimism in the market.” Inventory is higher than in 2022 but is still below what’s needed to achieve a balanced market.
“We continue to see multiple offers on well-priced properties, but overpriced homes are taking longer to sell. Sellers need to recognize that their home isn’t going to fetch the same amount of money that it would have last year, but buyers shouldn’t expect prices to drop drastically,” says O’Dywer. “In fact, prices in many markets are up from February. This could indicate that they’re bottoming out, and when the market shifts – and it always does – it usually happens without much of a warning.”
The board-wide benchmark price (MLS® Home Price Index) of a single-family home was $731,400 in March 2023, down 11% from one year ago and a slight dip from February. In the apartment category, the benchmark price was $405,400 last month, a 5% decrease from March 2022 and up by 2% from February. The year-over-year benchmark price of a townhouse was $563,300 in March, down 4% from one year ago and up slightly from February.
LINK to the March 2023 VIREB statistics.
STATS CENTRE REPORTS
The Stats Centre Reports for the REBGV for March are available now on our website at this link under the "BLOG AND STATS" heading. They are automatically updated every month on our website as they become available. LINK
Note that you may have to refresh the screen a few times until all the reports come up. This is a problem with the Real Estate Board website.