Happy New Year to you all! We hope that the holidays were happy and healthy for everyone.
Here are a few thoughts on how to create a more sustainable real estate market from our federal housing minister, although many would say that this is a little late:
Ban foreign home buyers, rezone cities for more density to reduce housing crunch says the Federal Minister.
Canada is grappling with a national housing crisis, as surging demand tied to the COVID-19 pandemic has sprawled beyond big cities and into smaller centers.
OTTAWA — Canada should temporarily ban foreign buyers and municipalities should rezone broadly to allow more density and to help alleviate the housing affordability crunch faced by residents, the country’s housing minister said on Tuesday.
Ahmed Hussen told Reuters in an interview that housing should be for Canadians to live in, not passive foreign investment, and that he backs Canadian cities implementing density measures like those recently rolled out in New Zealand, which allow up to three homes to be built on most single-family lots.
“I support that,” he said. “That’s one of the ways to easily increase housing supply by using the same land for single-family dwelling and creating more units.”
“Any measure that increases the housing supply, that intensifies the use of land, that builds more housing and that frees up more housing on the same amount of land, is a good thing,” he added.
To read the full article click here:
METRO VANCOUVER HOME SALES SET A RECORD IN 2021
Metro Vancouver home sales reached an all-time high in 2021 as housing needs remained a top priority for residents in the second year of the COVID-19 pandemic.
Residential home sales in the region were up by 42% in 2021 compared to sales recorded in 2020, up by 74% from 2019, and 4% higher than the previous all-time sales record set in 2015.
“Home has been a focus for residents throughout the pandemic. With low interest rates, increased household savings, more flexible work arrangements, and higher home prices than ever before, Metro Vancouverites, in record numbers, are assessing their housing needs and options,” Keith Stewart, REBGV economist said.
Home listings on the Multiple Listing Service® (MLS®) in Metro Vancouver reached 62,265 in 2021. This is a 15% increase compared to homes listed in 2020 and a 20% increase compared to homes listed in 2019.
“While steady, home listing activity didn't keep pace with the record demand we saw throughout 2021. This imbalance caused residential home prices to rise over the past 12 months,” Stewart said.
The total number of homes currently listed for sale on the MLS® in Metro Vancouver is 5,236, a 39% decrease compared to December 2020 and a 27% decrease compared to November 2021.
“We begin 2022 with just over 5,000 homes for sale across the region. This is the lowest level we’ve seen in more than 30 years,” Stewart said. “With demand at record levels, residents shouldn’t expect home price growth to relent until there’s a more adequate supply of housing available to purchase.”
The MLS® HPI composite benchmark price for all residential properties in Metro Vancouver ends the year at $1,230,200. This is a 17% increase compared to December 2020. Both detached home and townhome benchmark prices increased 22% in the region last year, while apartments increased 13%.
Looking across Metro Vancouver, Maple Ridge saw the largest increase in benchmark prices at 35%, followed by Pitt Meadows (30%), and Whistler (28%). Looking at area and property type, detached homes in Pitt Meadows saw the largest benchmark price increase at 42%, followed by detached homes (39%) and townhomes (35%) in Maple Ridge.
DECEMBER SUMMARY
REBGV reports that residential home sales in the region totalled 2,688 in December 2021, a 13% decrease from the December 2020 sales, and a 22% decrease from November 2021 sales.
There were 1,945 detached, attached and apartment properties newly listed for sale on the MLS® in Metro Vancouver in December 2021. This represents a 19% decrease compared to December 2020 listings and a 51% decrease compared to November 2021 listings.
For all property types, the sales-to-active listings ratio for December 2021 is 51%. By property type, the ratio is 35% for detached homes, 76% for townhomes, and 61% for apartments.
Generally, analysts say downward pressure on home prices occurs when the ratio dips below 12% for a sustained period, while home prices often experience upward pressure when it surpasses 20% over several months.
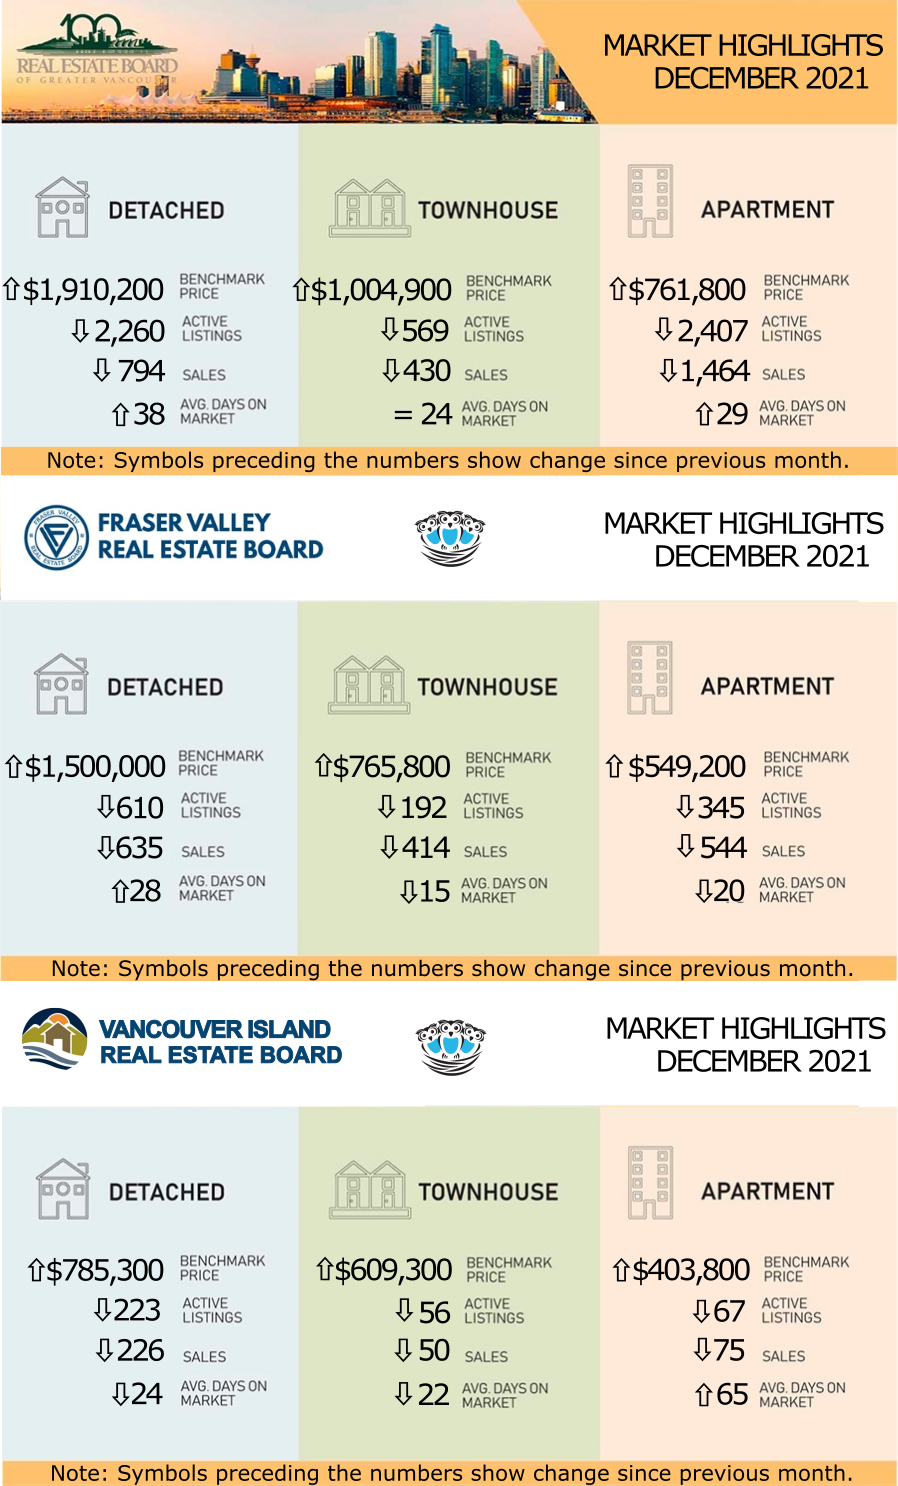
Sales of detached homes in December 2021 reached 794, a 23% decrease from the 1,026 sales recorded in December 2020. The benchmark price for a detached home is $1,910,200. This represents a 22% increase from December 2020 and a 2% increase compared to November 2021.
Sales of apartment homes reached 1,464 in December 2021, a 1.4% decrease compared to December 2020 sales. The benchmark price of an apartment home is $761,800. This represents a 13% increase from December 2020 and a 1.2% increase compared to November 2021.
Attached home sales (townhouses) in December 2021 totalled 430, a 28% decrease compared to December 2020 numbers. The benchmark price of an attached home is $1,004,900. This represents a 22% increase from December 2020 and a 1.5% increase compared to November 2021.
LINK to the December 2021 REBGV statistics.
FRASER VALLEY REAL ESTATE MARKET SEES BUSIEST YEAR IN 100-YEAR HISTORY
Fueled by the consumer response to the COVID-19 pandemic along with historically low interest rates, total property sales in the Fraser Valley in 2021 shattered the previous annual record last set in 2016.
The FVREB processed 27,692 sales on its Multiple Listing Service® (MLS®) in 2021, an increase of 39% compared to 2020 sales, and 15.5 % higher than 2016’s sales.
Larry Anderson, President of the Board, said, “No one could have predicted how the pandemic would impact the real estate market. Our region’s relative affordability, combined with a newfound ability to work from home and the value for housing dollar in the Fraser Valley attracted buyers in numbers like we’ve never seen. “Whether helping sellers list or helping buyers complete a sale, our Board averaged over 5,200 transactions every month. And even though our volume of new listings was also high, it just couldn’t keep up with the demand.”
Year-over-year, sales of detached homes soared by 32% in 2021 compared to 2020; townhome sales increased by 34% and sales of apartments increased by 69%.
Anderson added, “With the rapid escalation of prices in 2021, many buyers made decisions based on economic factors, resulting in an explosion of condo sales in our region.”
In 2021, the FVREB received 35,629 new listings – the second-highest on record (second only to 2008 at 35,651);
and 12% more than in 2020.
In the month of December, the Board’s MLS® processed 1,808 sales, second only to December 2020’s record-setting 2,086 sales. New listings in December were 1,278. By month’s end, active inventory finished at 1,957 units, 60% below the 10-year average, and the lowest in 41 years.
MLS® HPI Benchmark Price Activity
- Single Family Detached: At $1,500,000, the Benchmark price for an FVREB single-family detached home increased 3.6% compared to November 2021 and increased 39% year over year.
- Townhomes: At $765,800, the Benchmark price for an FVREB townhome increased 3.5% compared to November 2021 and increased 33% compared to December 2020.
- Apartments: At $549,200, the Benchmark price for an FVREB apartment/condo increased 3.5% compared to November 2021 and increased 25% year over year.
2021 ENDS WITH NEAR-RECORD SALES AND RECORD-LOW INVENTORY
The Vancouver Island Real Estate Board (VIREB) recorded 11,045 unit sales (all property types) in 2021, close to the 12,014 and 11,341 unit sales seen in 2016 and 2017. It is a remarkable outcome notwithstanding since it occurred amidst an environment of historically low inventory. Based on buyer demand, 2021 would have likely set a historic sales record with sufficient supply.
By category, active listings of single-family homes were 47% lower last month than in December 2020 and down by 26% from November. VIREB’s inventory of condo apartments declined by 71% from one year ago and was 30% lower than in November. Row/townhouse inventory dropped by 53% year over year and was 13% lower than the previous month.
As for sales, 226 single-family homes sold in December, a 25% decrease from one year ago and down 36% from November. There were 75 condo apartment sales last month compared to 124 one year ago and 110 the previous month. In the row/townhouse category, 50 units sold in December compared to 53 one year ago and 98 in November 2021.
According to the British Columbia Real Estate Association, the supply situation is especially critical in markets outside the Lower Mainland, with one of the worst being Vancouver Island. Even if sales were to return to long-run average levels, total listings would need to nearly double to achieve a balanced market, and the road to doubling those listings lies in building more homes.
Regarding housing costs, the board-wide benchmark price of a single-family home reached $785,300 in December, up 34% year over year. In the apartment category, the benchmark price hit $403,800 last month, a 29% increase from December 2020. The benchmark price of a townhouse increased by 35%, climbing to $609,300 in December.
In Campbell River, the benchmark price of a single-family home hit $689,000 in December, up by 32% from the previous year. In the Comox Valley, the year-over-year benchmark price rose by 31% to $800,400. The Cowichan Valley reported a benchmark price of $776,800, an increase of 30% from December 2020. Nanaimo’s benchmark price rose by 32%, reaching $790,000, while the Parksville-Qualicum area saw its benchmark price increase by 37% to $927,100. The cost of a benchmark single-family home in Port Alberni reached $523,700, a 43% year-over-year increase. The benchmark price of a single-family home for the North Island rose by 46% to $424,600.
LINK to the December 2021 VIREB statistics.
STATS CENTRE REPORTS
The Stats Centre Reports for the REBGV for November are available now on our website at this link under the "BLOG AND STATS" heading. They are automatically updated every month on our website as they become available. LINK
Note that you may have to refresh the screen a few times until all the reports come up. This is a problem with the Real Estate Board website.
Below is a link to a graph showing the rise in prices in the Lower Mainland just for resale properties (no new homes) over the last year. This link is live so it will update when the new statistics come in each month. LINK to live graph