July of 2021 is going to be the standard to which all future sleepy real estate markets are compared. In the Fraser Valley, there haven't been this few new listings on the market for 40 years! The fact that the population of that area has gone up substantially over that same period of time makes this an even more staggering statistic.
Why is this happening? Perhaps, the pent-up demand to travel, either internationally or domestically, has put sellers' plans on hold. Or, sellers are seeing the trend of fewer listings and are worried that they won't be able to buy a new home for themselves if they sell their homes.
I believe that we will see listings start to appear again in earnest in early September.
STEADY SALES, REDUCED LISTINGS AND VIRTUALLY UNCHANGED HOME PRICES IN JULY
Metro Vancouver’s housing market saw more moderate sales, listings and pricing trends in July compared to the heightened activity experienced throughout much of the pandemic.
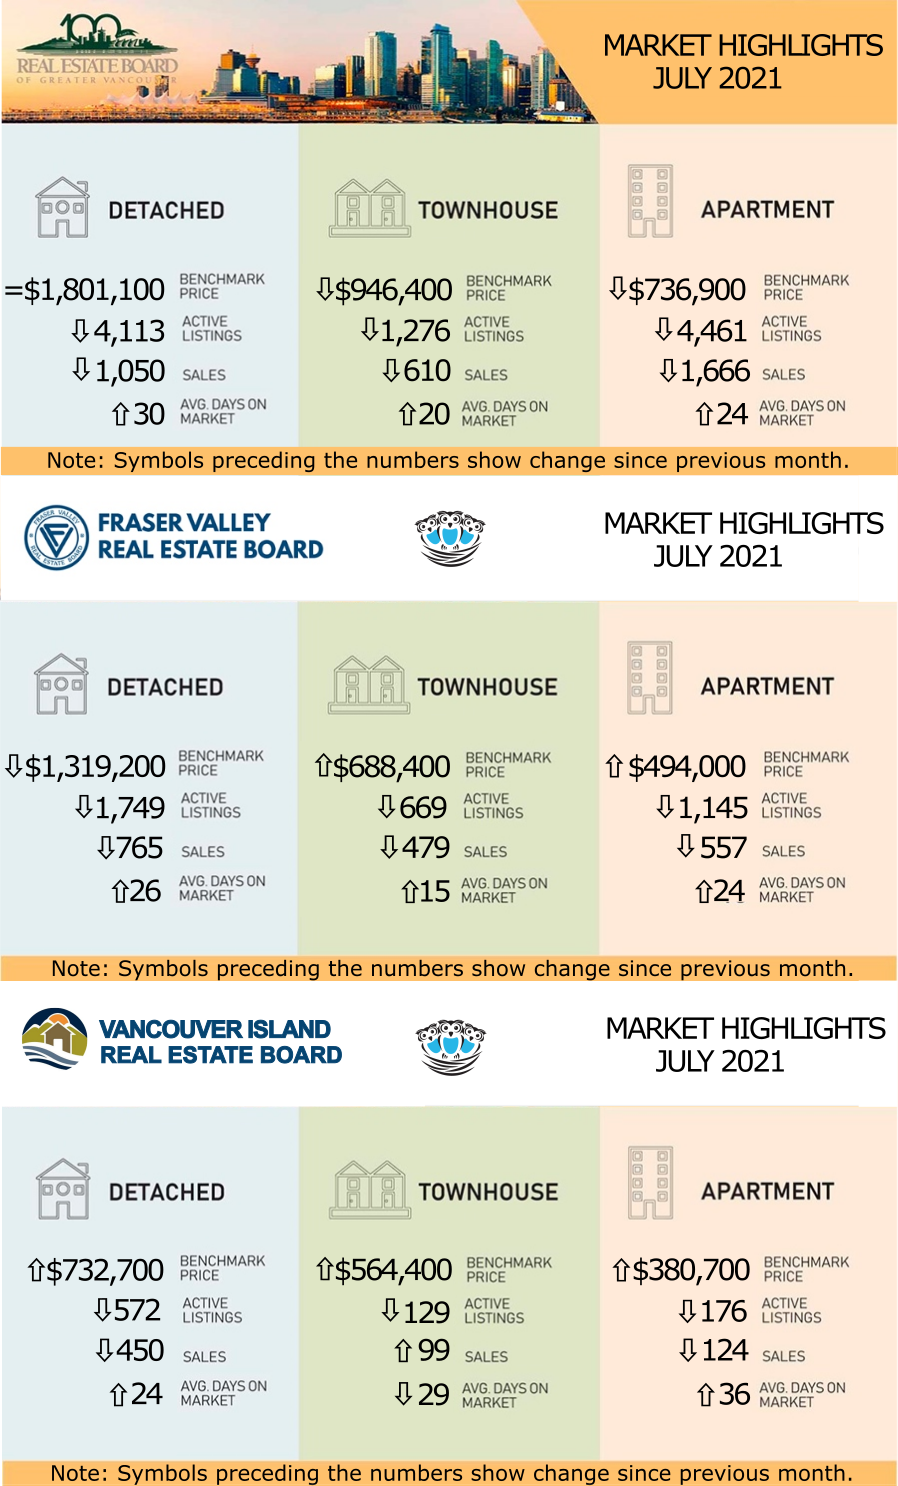
The Real Estate Board of Greater Vancouver (REBGV) reports that residential home sales totalled 3,326 in July 2021, a 6% increase from the 3,128 sales recorded in July 2020, and an 12% decrease from the 3,762 homes sold in June 2021. Last month’s sales were 13% above the 10-year July sales average.
“Moderation was the name of the game in July,” said REBGV’s economist Keith Stewart. “Home sales and listings fell in line with typical seasonal patterns as summer got going in earnest in July. On top of moderating market activity, price growth has levelled off in most areas and home types.”
There were 4,377 detached, attached and apartment homes newly listed for sale on the MLS® in Metro Vancouver in July 2021. This represents a 26% decrease compared to the 5,948 homes listed in July 2020 and a 25% decrease compared to June 2021 when 5,849 homes were listed. July’s new listings were 12% below the 10-year average for the month.
The total number of homes currently listed for sale on the MLS® system in Metro Vancouver is 9,850, an 19% decrease compared to July 2020 and a 9% decrease compared to June 2021.
“Low housing supply remains a fundamental factor in Metro Vancouver’s housing market,” Stewart said. "Home sales remain above average and we’re starting to see price increases relent as well. Going forward, the supply of homes for sale will be among the most critical factors to watch. This will determine the next direction for house price trends."
For all property types, the sales-to-active listings ratio for July 2021 is 34%. By property type, the ratio is 26% for detached homes, 48% for townhomes, and 37% for apartments. Generally, analysts say downward pressure on home prices occurs when the ratio dips below 12% for a sustained period, while home prices often experience upward pressure when it surpasses 20% over several months.
The MLS® Home Price Index composite benchmark price for all residential properties in Metro Vancouver is currently $1,175,500. This represents a 14% increase over July 2020 and is unchanged from June 2021.
Sales of detached homes in July 2021 reached 1,050, a 6% decrease from the 1,121 detached sales recorded in July 2020. The benchmark price for a detached home is $1,801,100. This represents a 21% increase from July 2020 and is unchanged from June 2021.
Sales of apartment homes reached 1,666 in July 2021, a 19% increase compared to the 1,400 sales in July 2020. The benchmark price of an apartment property is $736,900. This represents an 8% increase from July 2020 and a 0.1% decrease compared to June 2021.
Attached home sales in July 2021 totalled 610, a 0.5% increase compared to the 607 sales in July 2020. The benchmark price of an attached home is $949,400. This represents a 17% increase from July 2020 and a 0.3% increase compared to June 2021.
LINK to the July 2021 REBGV statistics.
FRASER VALLEY HOME SALES REMAINED STEADY IN JULY; LOWEST SUPPLY IN FORTY YEARS
FRASER VALLEY HOME SALES REMAINED STEADY IN JULY; LOWEST SUPPLY IN FORTY YEARS
The Board processed a total of 2,006 property sales in July, a decrease of 11% compared to June and a 4.5% decrease compared to the same month last year. Sales continued to remain above normal for July – 15% above the 10-year average.
Larry Anderson, President of the Board, said, “A summer slowdown is typical. We anticipated that once people could travel and enjoy family time safely, they would do so, and we couldn’t be happier for everyone. “Demand for homes in our region, however, remains above average – for fourteen months we have been in a seller’s market for Fraser Valley detached homes, townhomes and condos – and yet for the last four months, new listings in our region have been decreasing.”
In July, the Board received 2,431 new listings, a decrease of 32% compared to last year, and a decrease of 22% compared to June 2021. The month ended with total active inventory sitting at 4,901, an 11% decrease compared to June, and 33% fewer than July 2021.
Baldev Gill, Chief Executive Officer of the Board, added, “To put our market in perspective, we just came off the third-highest sales for July in the last ten years, while home buyers looking to invest in the Fraser Valley had the same level of inventory to choose from that they had forty years ago. “For the market to reach equilibrium and upward pressure on prices to decrease, we need more inventory.”
LINK to the July 2021 FVREB statistics.
SLIGHT COOLING LIKELY DUE TO HISTORICALLY LOW INVENTORY
Last month, the Vancouver Island Real Estate Board (VIREB) saw sales of 450 single-family detached properties compared to 531 in June, a decrease of 15%. In the condo apartment category, sales dropped by seven % from June 2021. However, row/townhouse sales rose by 29% from the previous month.
Inventory remains extremely tight in the VIREB area, tracking at a 21-year historical low. Active listings of single-family homes and row/townhouses dropped by 51% from July 2020. In the condo apartment category, inventory decreased by 60% from one year ago.
Based on the demand VIREB is seeing, there is no doubt that sales would be higher if there were sufficient inventory. The British Columbia Real Estate Association (BCREA) forecasts that market conditions may begin to even out somewhat by the end of the year. However, it would take approximately 2,500 new listings in the VIREB area to create an actual balanced market if activity continues at this pace.
VIREB president Ian Mackay reiterates what VIREB and other real estate boards have been saying for several months. “Unless demand drops significantly or more housing supply comes online through new construction, the needle for VIREB’s inventory situation will not move by much,” states Mackay. “BCREA, VIREB, and other real estate boards continue advocating with policymakers at the provincial and regional levels to speed up the development process so that municipalities can expand supply more quickly to meet demand.” Mackay adds that building more homes is not a quick solution, but VIREB believes it is the only one that will address the lack of affordable housing.
VIREB’s heated housing market continues to impact prices, which continue to increase throughout the board area. The board-wide benchmark price of a single-family home reached $732,700 in July, up 33% year over year and 3% from June. In the apartment category, the benchmark price was 4% higher than the previous month and 24% higher year over year, reaching $380,700. The benchmark price of a townhouse rose by 32% year over year and by 3% from June, climbing to $564,400.
In Campbell River, the benchmark price of a single-family home hit $639,100 in July, up by 33% from the previous year. In the Comox Valley, the year-over-year benchmark price rose by 30% to $765,200. The Cowichan Valley reported a benchmark price of $723,800, an increase of 32% from July 2020. Nanaimo’s benchmark price rose by 31%, hitting $739,000, while the Parksville-Qualicum area saw its benchmark price increase by 34% to $850,100. The cost of a benchmark single-family home in Port Alberni reached $488,100, a 47% year-over-year increase. The benchmark price for the North Island also rose by 47%, hitting $384,200 in July.
LINK to the July 2021 VIREB statistics.
STATS CENTRE REPORTS
The Stats Centre Reports for the REBGV for July are available now on our website at this link under the "BLOG AND STATS" heading. They are automatically updated every month on our website as they become available. LINK
Note that you may have to refresh the screen a few times until all the reports come up. This is a problem with the Real Estate Board website.
Below is a link to a graph showing the rise in prices in the Lower Mainland just for resale properties (no new homes) over the last year. This link is live so it will update when the new statistics come in each month. LINK to live graph
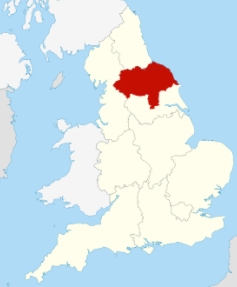
IN THE INTEREST OF INCREASING THE NUMBER OF POTENTIAL LISTINGS TO CHOOSE FROM...
We have to go a little farther afield to "the Island"...of Great Britain.
A lovely 2 bedroom apartment located in this area:
and in this building: (Click the picture to see the listing.)

The monthly maintenance fee has to be huge!
MANY OF YOU MAY ALREADY KNOW THE DISTINCTION BETWEEN: