October kept the momentum of the last 3 or 4 months going with the number of sales close to record levels. A reducing number of available listings may have even blunted the potential for higher levels. November has been much more sedate in contrast with sales trending at about 50% of an equivalent period in October. We'll have to see if this continues throughout the rest of the Fall season. Good news about potential vaccines has energized the stock market and it may be just a matter of time before that exuberance spills over into real estate again.
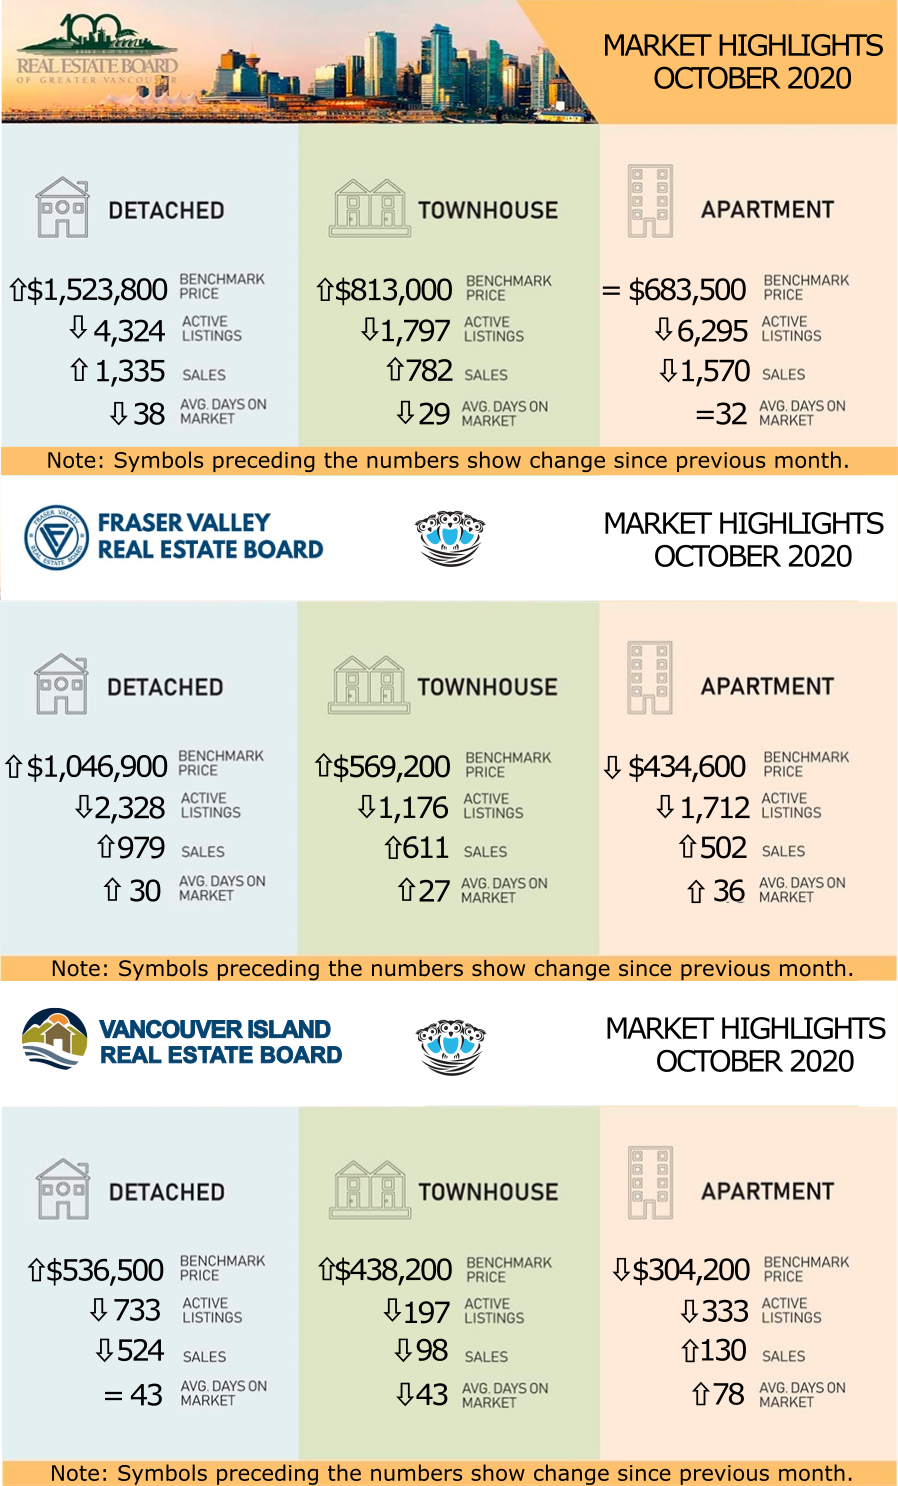
"Home sale and new listing activity remained at near-record levels across Metro Vancouver* in October.
The Real Estate Board of Greater Vancouver (REBGV) reports that residential home sales in the region totalled 3,687 in October 2020, a 29 percent increase from the 2,858 sales recorded in October 2019, and a 1.2 percent increase from the 3,643 homes sold in September 2020.
Last month’s sales were 34.7 percent above the 10-year October sales average and stand as the second-highest total on record for the month.
“Home has been a focus for residents during the pandemic. With more days and evenings spent at home this year, people are re-thinking their housing situation," Colette Gerber, REBGV Chair said. “Throughout this period, REALTORS® have been working to understand and adapt to the latest safety protocols so that they can continue to help the public meet their housing needs in a safe and responsible way.”
Link to the full Greater Vancouver Stats Report
Volumes remain exceptional in the Fraser Valley
Ongoing demand for Fraser Valley real estate saw overall sales reach the highest point for the month of October in the Board’s history. This is the fourth consecutive month of record-breaking or near-record activity for sales and new listings in the region.
The volume of new listings received by the Board in October dipped compared to September, however, still ranked the highest for the month in the last decade and the fourth highest of all time. The Board received 3,081, a 12.3 percent decrease compared to September’s intake and a 29.3 percent increase compared to October 2019.
Chris Shields, President of the Board, observes, “The situation is unprecedented. We are in the middle of a pandemic and in many of our communities we are seeing a strong seller’s market for townhomes and single-family homes priced correctly. For example, in Langley, our current supply of detached homes would sell in 1.4 months if no new listings became available. And for Mission townhomes, we have zero months of inventory."
“If you’re thinking of buying or selling, seek expert advice because every neighbourhood and property type is unique.”
Breaking those numbers down, 524 single-family detached properties (excluding acreage and waterfront) sold in October compared to 342 the previous year, a 53 percent increase but a decrease of 18 percent from September. Sales of condo apartments rose by 48 percent year over year and six percent month over month. Row/townhouse sales increased by 51 percent from October 2019 but dipped by 10 percent from the previous month.
"Although sales are down somewhat from September, we attribute it to a lack of inventory, not a weakening market,” says VIREB president Kevin Reid. “Demand in the VIREB area continues to be high, but there just aren’t enough homes to satisfy it.”"
Link to the full Vancouver Island Stats Report
The Stats Centre Reports for the REBGV for October are available now on our website at this link under the "BLOG AND STATS" heading. They are automatically updated every month on our website as they become available. LINK
Note that you may have to refresh the screen a few times until all the reports come up. This is a problem with the Real Estate Board website.
Below is a link to a graph showing the rise in prices in the Lower Mainland just for resale properties (no new homes) over the last year. This link is live so it will update when the new statistics come in each month. LINK to live graph
Stay safe everyone!
Cheers,
Barry, Olga, and Alice


#6-228 Schoolhouse Street, Coquitlam, BC, V3K 6V7