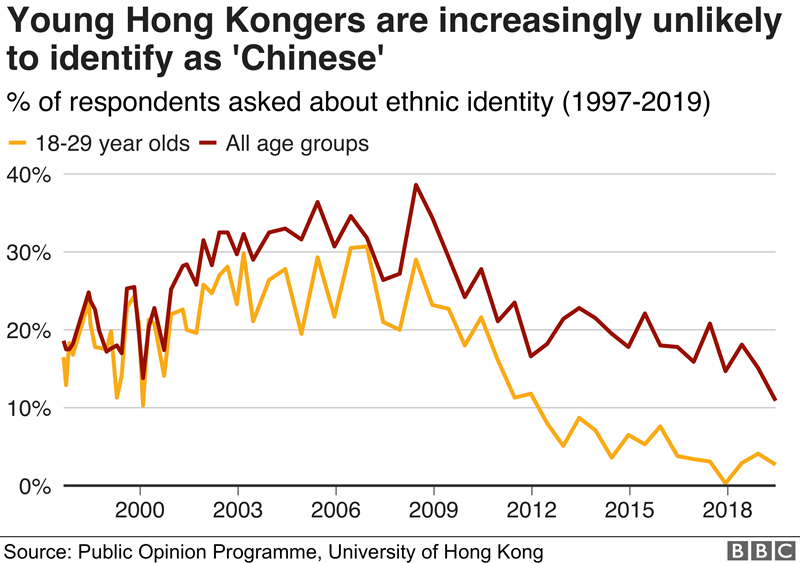
Dear %%FirstName%%, This has been a tumultuous month in international relations and conflicts around the world that may have some effect on the local real estate market. The trade war with China is intensifying across the border and it brings some unexpected benefits to Canada's economy with increased sales of electronic circuit boards, industrial molds to the US and soybeans to China. China is getting most of its soybeans from Brazil now instead of the US, with about $1.5 Billion worth of the $12 to 13 Billion that they normally import coming from Canada's farms. As well, the worrying tensions between Hong Kong and China is not abating. Many Hong Kong residents are claiming that Mainland China is increasingly meddling in the affairs of government, the Courts, and even the media, with many journalists feeling that they have to self-censor or perhaps face repercussions in the future. What's more, the average resident of Hong Kong doesn't identify as Chinese, but rather, as "Hong Kongers". Only 11% of those polled identify as Chinese, as per the graph below.
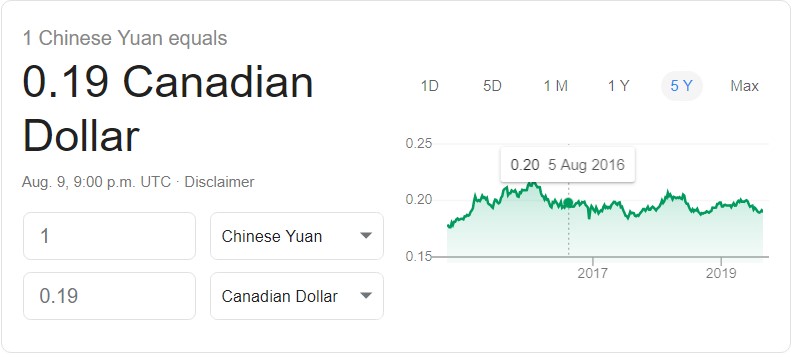
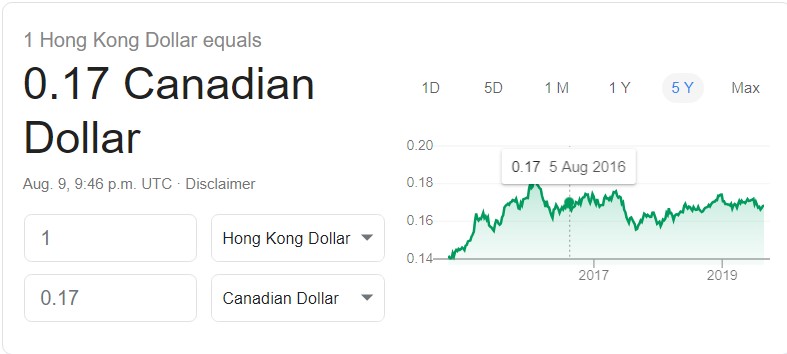
One of the points of contention is that of extradition rights. There are concerns that the Courts in China can be politically biased, and may mete out very harsh penalties. In response to this uncertainty, I would expect that we may see a higher flow of capital out of Hong Kong to such safe havens as Canada, Australia, etc. How will this impact our local market is hard to say but I would venture that it would revitalize the slumbering Vancouver West and West Vancouver regions where foreign money tends to settle. Since Montreal has decided not to institute a Foreign Buyer's Tax (FBT) like the Lower Mainland and the Greater Toronto Area (GTA), the city has seen their luxury real estate purchases by foreign buyers skyrocket. This could be an indication of Hong Kong money flight. Since Vancouver has seen a general weakening of prices since the Foreign Buyer's Tax was instituted along with more stringent lending guidelines, it might entice a foreign buyer looking for a safe haven for their money to park some of it in our real estate as it did with the Mainland Chinese in the last few years. As well, our dollar has held value in the last three years against the Chinese and Hong Kong currencies. The graphs below show the closest date to which the Foreign Buyer's Tax was implemented and it compares well with today's posted rates (in large text.)
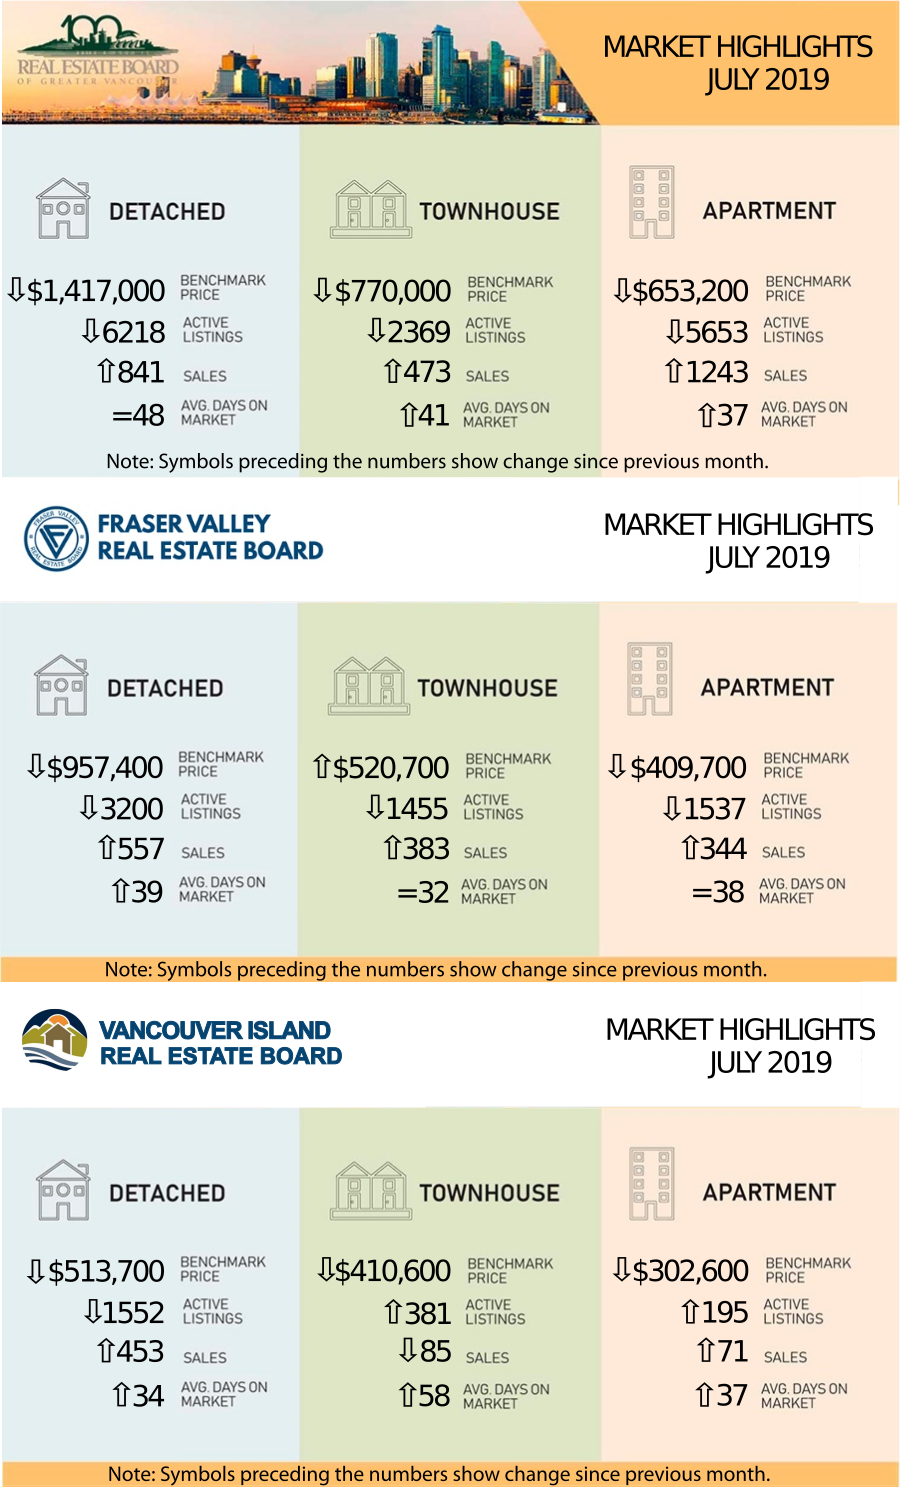
July of 2019 brought a flurry of buyer activity across the Lower Mainland, Fraser Valley, and Vancouver Island regions which were well over June of 2019's numbers. Only the Vancouver Island Board exceeded last July's sales figures. After the first week of August, these are some of the highlights:
From the REBGV July Statistics: "The Real Estate Board of Greater Vancouver (REBGV) reports that residential home sales in the Last month’s sales were 7.8 per cent below the 10-year July sales average."
From the Fraser Valley Board's July Statistics: "The Fraser Valley Real Estate Board processed 1,458 sales of all property types on its Multiple Listing Service® (MLS®) in
The Sales to Active ratios for Greater Vancouver and Fraser Valley Boards are still in the range where there isn't significant upward or downward pressure on prices.
Generally, analysts say that downward pressure on home prices occurs when the ratio dips below the 12 per cent mark for a sustained period, while home prices often experience upward pressure when it surpasses 20 per cent over several months. Click on the links (in blue) below for the statistics package for your area: (The links each take a few second to open as they are files stored on my Google Drive.) |
| BURNABY/NEW WEST | |||
| Burnaby East | Burnaby North | Burnaby South | New Westminster |
| TRI-CITIES | |||
| Coquitlam | Port Coquitlam | Port Moody | |
| VANCOUVER | |||
| Metro Vancouver | Vancouver East | ||
| NORTH SHORE | |||
| North Vancouver | West Vancouver | ||
| SOUTH FRASER/RICHMOND | |||
| Ladner | Tsawwassen | Richmond | |
| RIDGE MEADOWS | |||
| Pitt Meadows | Maple Ridge | ||
| UP THE COAST/ISLAND | |||
| Bowen Island | Squamish | Sunshine Coast | Whistler |
Here are the full statistic packages for Greater Vancouver, the Fraser Valley (which includes Surrey, North Surrey, South Surrey/White Rock, Cloverdale, Delta, Langley, Abbotsford, Chilliwack, and Mission), and Vancouver Island (which includes Campbell River, Comox, Duncan, Nanaimo, Parksville/Qualicum, and Port Alberni.) Below is a link to a graph showing the rise in prices in the Lower Mainland just for resale properties (no new homes) over the last year. This link is live so it will update when the new statistics come in each month. LINK to live graph
Featured Video of the Month: Canada’s mortgage stress tests just got a little easier The interest rate used in Canada’s mortgage stress tests has fallen for the first time since 2016, making it slightly easier to become a homeowner. The mortgage qualifying rate dropped to 5.19 per cent from 5.34 per cent, where it had been locked since May of 2018, according to new figures from the Bank of Canada. The rate is derived from the most frequently occurring five-year, fixed posted rates at Canada’s Big Six banks. (Market rates are much lower, and some discount lenders offer five-year fixed rates as low as 2.47 per cent.) The qualifying rate had increased several times during 2017 and 2018 as the Bank of Canada raised its key interest rate, and as bond yields headed higher. But there’s been a notable shift in lending conditions as many central banks across the globe look to ease policies. Moreover, Canada’s five-year bond yield, which influences the direction of five-year fixed-rate mortgages, has tumbled this year. As a result, those mortgage rates have plunged roughly 70 basis points, according to a recent research note from BMO Nesbitt Burns. Click here for the article from Globe & Mail: https://tgam.ca/2Gh0zS0
Please feel free to contact us if you would like specific information for your neighborhood, would like to be set up on a search to keep track of your local market, or if you would like a market evaluation of the value of your home.
|