Ok. Where did that come from? All of a sudden we are back at a sales level that is very close to the 10-year average in both the Greater Vancouver and Fraser Valley Real Estate Boards! Prices are generally slightly lower in most areas, though. We'll have to see if this trend of higher buyer activity continues through October. Anecdotally, we are seeing quite well-attended Open Houses.
And....on to the statistics.
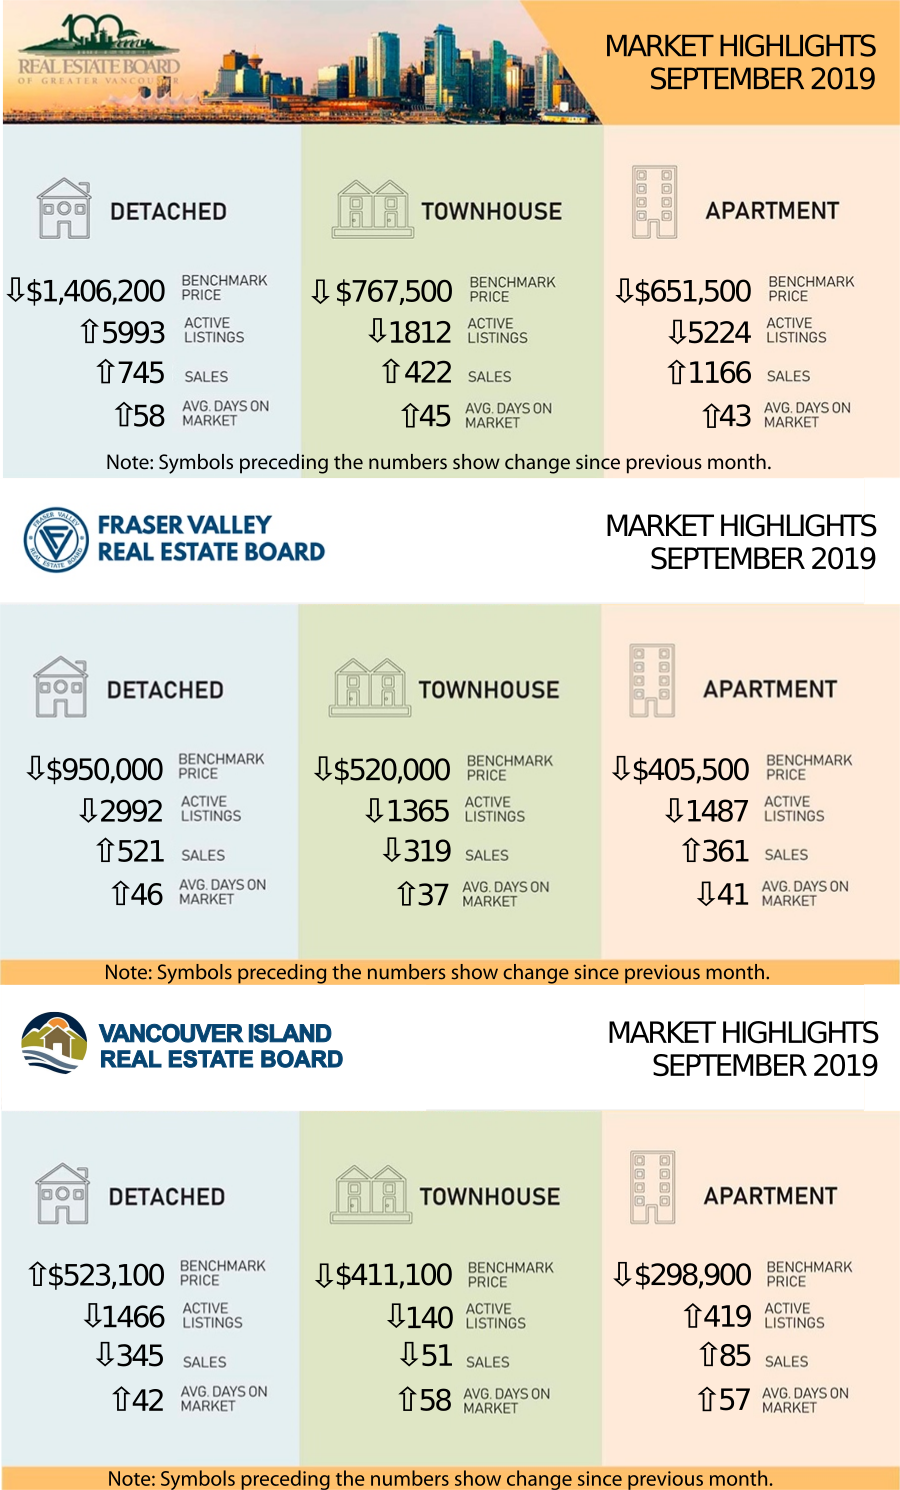
September of 2019 brought the Great Vancouver real estate market quite close to the 10 year sales average. Greater Vancouver's sales were only 1.7% below and the Fraser Valley was above. (No number was given.)
We are into the first week of October and here are some of the highlights:
- Multiple offers are becoming more plentiful than in past months on some well-priced and well-presented homes although the sale prices have been very close to the asking price and not always above as in years past.
- Open Houses are becoming well attended again.
- Interest rates are remaining relatively flat although some lenders have raised their rates about 5 basis points. The best rate that I've found is 2.44% for a 5 year fixed mortgage under fairly restrictive circumstances.
- The First Time Home Buyer Incentive is now active which is where you can apply for a 5-10% shared equity mortgage with the Government of Canada. More information HERE
- The Bank of Canada (BoC) has kept their lending rate at 1.75% but it remains a mystery what they will do before the end of the year.
From the REBGV September Statistics:
"The Real Estate Board of Greater Vancouver (REBGV) reports that residential home sales in the region totaled 2,233 in September 2019, a 46.3 per cent increase from the 1,595 sales recorded in September 2018, and a 4.6 per cent increase from the 2,231 homes sold in August 2019."
From the Fraser Valley Board's September Statistics:
"The Fraser Valley Real Estate Board processed 1,343 sales of all property types on its Multiple Listing Service® (MLS®) in September, a 3.5 per cent increase compared to sales in August 2019, and a 29.8 per cent increase compared to the 1,035 sales in September of last year."
| BURNABY/NEW WEST | |||
| Burnaby East | Burnaby North | Burnaby South | New Westminster |
| TRI-CITIES | |||
| Coquitlam | Port Coquitlam | Port Moody | |
| VANCOUVER | |||
| Metro Vancouver | Vancouver East | ||
| NORTH SHORE | |||
| North Vancouver | West Vancouver | ||
| SOUTH FRASER/RICHMOND | |||
| Ladner | Tsawwassen | Richmond | |
| RIDGE MEADOWS | |||
| Pitt Meadows | Maple Ridge | ||
| UP THE COAST/ISLAND | |||
| Bowen Island | Squamish | Sunshine Coast | Whistler |
Here are the full statistic packages for Greater Vancouver, the Fraser Valley (which includes Surrey, North Surrey, South Surrey/White Rock, Cloverdale, Delta, Langley, Abbotsford, Chilliwack, and Mission), and Vancouver Island (which includes Campbell River, Comox, Duncan, Nanaimo, Parksville/Qualicum, and Port Alberni.)
Below is a link to a graph showing the rise in prices in the Lower Mainland just for resale properties (no new homes) over the last year. This link is live so it will update when the new statistics come in each month. LINK to live graph
Featured Video of the Month: (Click on image)
 Quick and Budget-Friendly DIY Fixes Video
And now, for a little fun. An entertaining "Beer Magician". (Note that I have the video starting well past the normal introductory preamble in the show.)