I hope you are enjoying the mostly mild summer weather and have a chance to relax a little since we all stopped working for the Tax Man by Tax Freedom Day. Yay! You'll notice that we are starting to include the Vancouver Island Real Estate Board statistics as many of our clients have moved across the water. We've just come through the first week of July and the mild recovery that we experienced in June has reversed its course.
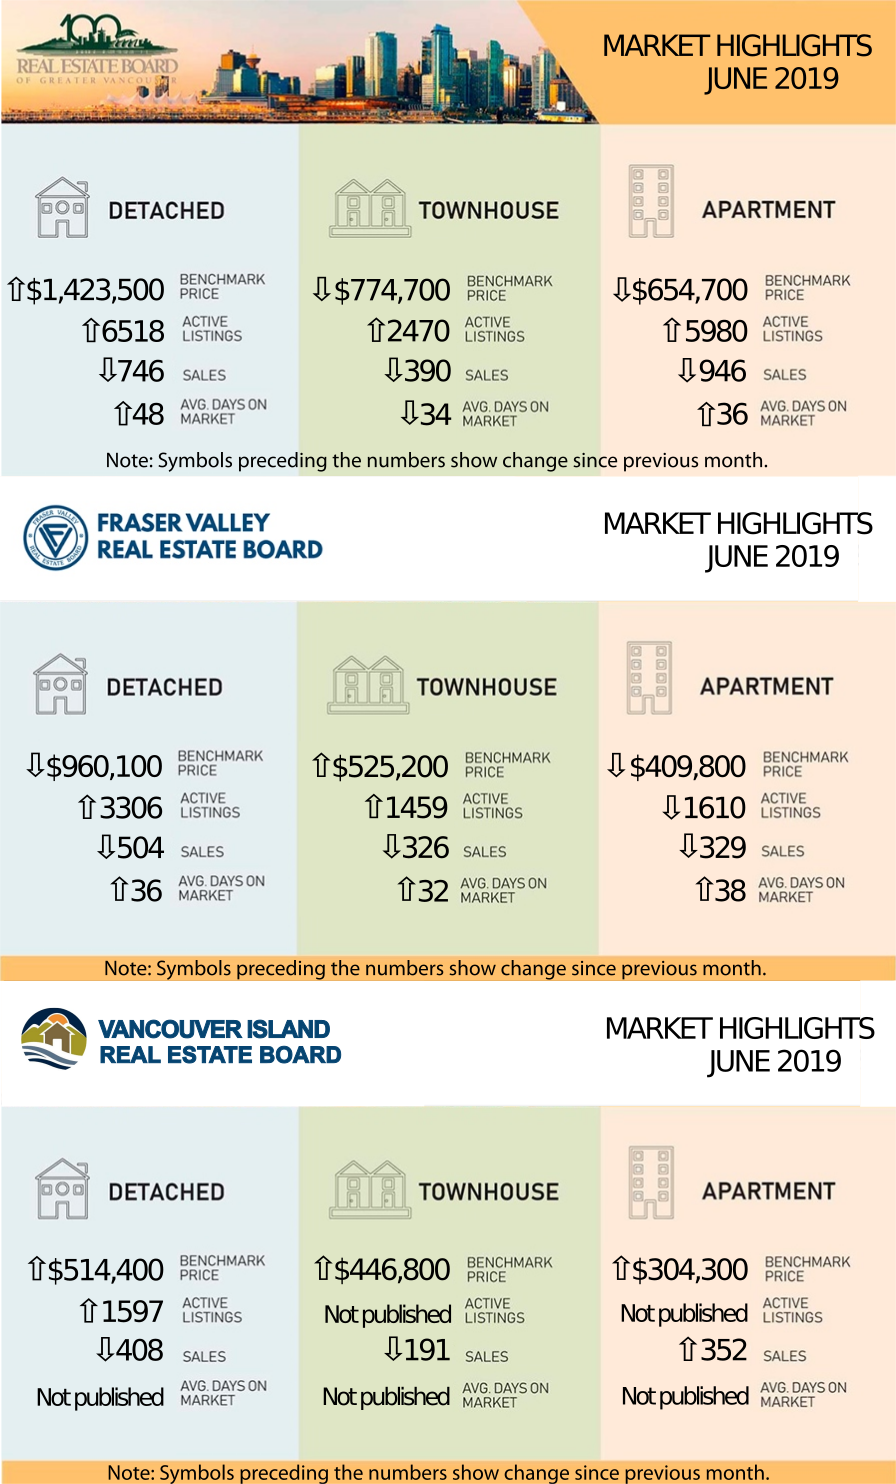
From the REBGV June Statistics: "The Real Estate Board of Greater Vancouver (REBGV) reports that residential home sales in the
From the Fraser Valley Board's May Statistics: "The Fraser Valley Real Estate Board processed 1,306 sales of all property types on its Multiple Listing Service® (MLS®) in
The Sales to Active ratios for both real estate boards have headed back down to the range where we are going to see downward price pressure as we had at the end of 2018.
Generally, analysts say that downward pressure on home prices occurs when the ratio dips below the 12 per cent mark for a sustained period, while home prices often experience upward pressure when it surpasses 20 per cent over several months. Click on the links (in blue) below for the statistics package for your area: (The links each take a few second to open as they are files stored on my Google Drive.) |
| BURNABY/NEW WEST | |||
| Burnaby East | Burnaby North | Burnaby South | New Westminster |
| TRI-CITIES | |||
| Coquitlam | Port Coquitlam | Port Moody | |
| VANCOUVER | |||
| Metro Vancouver | Vancouver East | ||
| NORTH SHORE | |||
| North Vancouver | West Vancouver | ||
| SOUTH FRASER/RICHMOND | |||
| Ladner | Tsawwassen | Richmond | |
| RIDGE MEADOWS | |||
| Pitt Meadows | Maple Ridge | ||
| UP THE COAST/ISLAND | |||
| Bowen Island | Squamish | Sunshine Coast | Whistler |
Here are the full statistic packages for Greater Vancouver, the Fraser Valley (which includes Surrey, North Surrey, South Surrey/White Rock, Cloverdale, Delta, Langley, Abbotsford, Chilliwack, and Mission), and Vancouver Island (which includes Campbell River, Comox, Duncan, Nanaimo, Parksville/Qualicum, and Port Alberni.) Below is a link to a graph showing the rise in prices in the Lower Mainland just for resale properties (no new homes) over the last year. This link is live so it will update when the new statistics come in each month. LINK to live graph ______________________________________________________ Understanding how credit scores work Lenders want to give you a mortgage, but they also want to minimize their own risk. The easiest way to determine risk in a client is by using your credit scores to make their lending decisions. Credit scores are compiled separately by two consumer reporting agencies -- Equifax and Trans Union. These credit reporting bureaus calculate scores differently, and base their scores on information that may differ from other bureaus while both score in a range of 300 to 900. The higher your credit score, the lower you are deemed a risk to lenders. When you apply for a home loan, your application includes giving your lender permission to "pull your credit" and base the decision to lend to you and the rate of interest on the information contained in your credit scores. The higher the score, the better the terms that you'll receive from the lender. Unfortunately, it's not possible to know exactly how many points your score will go up or down based on the actions you take. Credit bureaus and lenders don't share the actual formulas they use to calculate credit scores. Factors that may affect your credit score include: - How long you've had credit - If you carry a balance on your credit cards - If you regularly miss payments - The amount of your outstanding debts - Being close to your credit limit - The number of times you try to get more credit - The types of credit you're using - If your debts have been sent to a collection agency - Any record of insolvency or bankruptcy Lenders set their own guidelines as to the minimum credit score you need for them to lend you money. If you have a good credit score, you may be able to negotiate lower interest rates. However, when you order your credit score, it may not be the same as a score produced for a lender. This is because a lender may put more weight on certain information when calculating your credit score. Be sure to contact your own mortgage professional for individual credit score information.
Please feel free to contact us if you would like specific information for your neighborhood, would like to be set up on a search to keep track of your local market, or if you would like a market evaluation of the value of your home.
|