We hope that you enjoyed the first month of 2019 and those that have made New Year's resolutions are managing to maintain those improved habits.
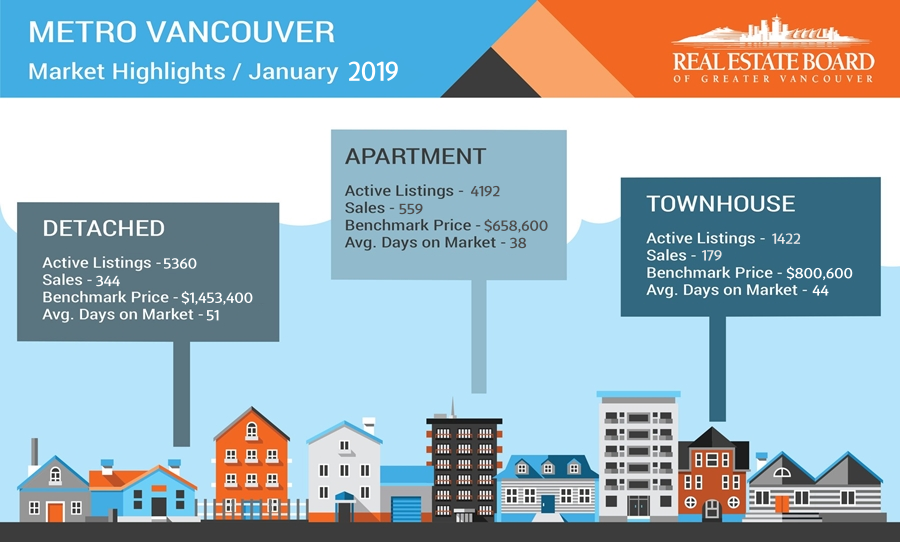
In regards to the last month in real estate, try to imagine the sound of crickets. It was that slow. In regards to sales, the REBGV reported 1103 sales whereas the Fraser Valley Board reported 784. These numbers are 39% and 35% respectively below last January's numbers.
The Sales to Active ratios have also dropped substantially for both the Greater Vancouver and Fraser Valley real estate boards.
Generally, analysts say that downward pressure on home prices occurs when the ratio dips below the 12 per cent mark for a sustained period, while home prices often experience upward pressure when it surpasses 20 per cent over several months.
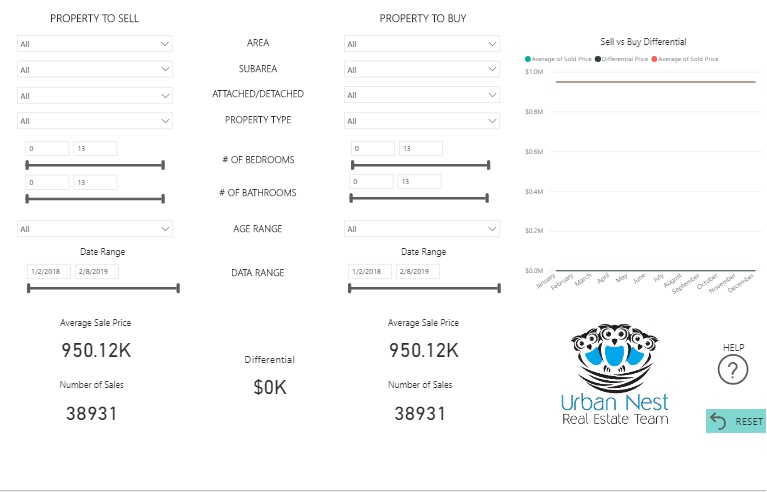
Here is a link to a comparison tool to determine what the approximate value is between different types of properties, or properties within different areas for those that are considering moving up or down in size or relocating closer to their desired area.. LINK or click the image below.
Here's an image of the property comparison tool. Please let me know if you have any problems with it or have suggestions on how it can be improved. I'll be sending out another link in the next week or so once I've produced a different (and more detailed) property valuation tool.
Included below are the latest statistics for real estate in the REBGV (Real Estate Board of Greater Vancouver) and FVREB (Fraser Valley Real Estate Board) areas. You will find a clickable link to each area below which will open up as a separate PDF file.
Click on the links (in blue) below for the statistics package for your area:
(The links each take a few second to open as they are files stored on my Google Drive.)
Here are the full statistic packages for Greater Vancouver and the Fraser Valley (which includes Surrey, North Surrey, South Surrey/White Rock, Cloverdale, Delta, Langley, Abbotsford, Chilliwack, and Mission.)
Below is a link to a graph showing the rise in prices in the Lower Mainland just for resale properties (no new homes) over the last year. This link is live so it will update when the new statistics come in each month. LINK to live graph
Please feel free to contact us if you would like specific information for your sub-area or if you would like a market evaluation of the value of your home.
Barry, Olga, and Alice
@media only screen and (max-width: 480px) {
table#canspamBar td {
font-size:14px !important;
}
table#canspamBar td a {
display:block !important;
margin-top:10px !important;
}
}