We're into the fourth month of 2019 already and sales are continuing to sag compared to the 10 year average. The past month's sales for the Metro Vancouver region haven't been this low since 1986. Is it significant that that year was Expo '86 in Vancouver?
In regards to sales, the REBGV reported 1727 sales (1484 last month) whereas the Fraser Valley Board reported 1221 sales (982 last month). These numbers are 31.4% and 26.6% respectively below last March's numbers.
The number of sales for the REBGV are 46.3% below the 10-year March sales average.
The Sales to Active ratios have experienced a slight rise since the beginning of the year which may be the start of a recovery or may just be the rise that we see every year between January and March.
Generally, analysts say that downward pressure on home prices occurs when the ratio dips below the 12 per cent mark for a sustained period, while home prices often experience upward pressure when it surpasses 20 per cent over several months.
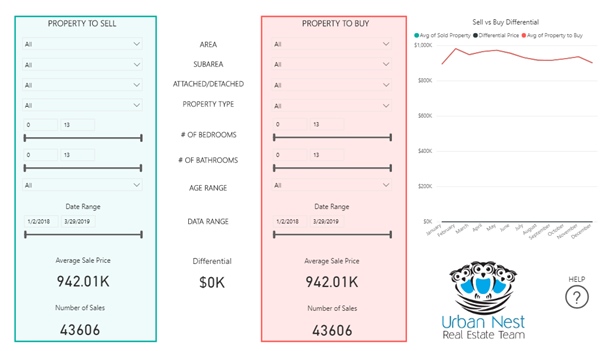
Here is a link to a comparison tool to determine what the approximate value is between different types of properties, or properties within different areas for those that are considering moving up or down in size or relocating closer to their desired area.. LINK or click the image below.
Here's an image of the property comparison tool. Please let me know if you have any problems with it or have suggestions on how it can be improved. I'm a little behind on the generation of a different (and more detailed) property valuation tool.
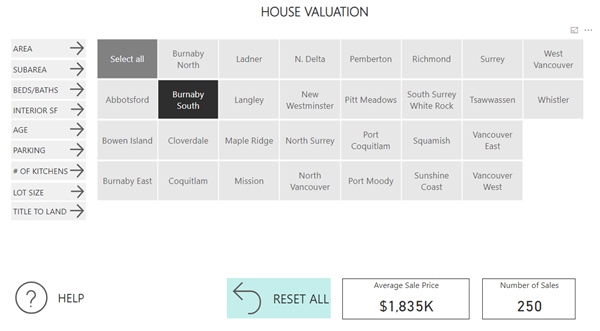
As well, I've been working on a home valuation tool that uses the last 14 months of sold data from the Real Estate Boards of Greater Vancouver and the Fraser Valley. This is a work in progress and only has functionality for houses at this time. Please feel free to give us any suggestions or feedback if it didn't work properly on your device. Here's the LINK.
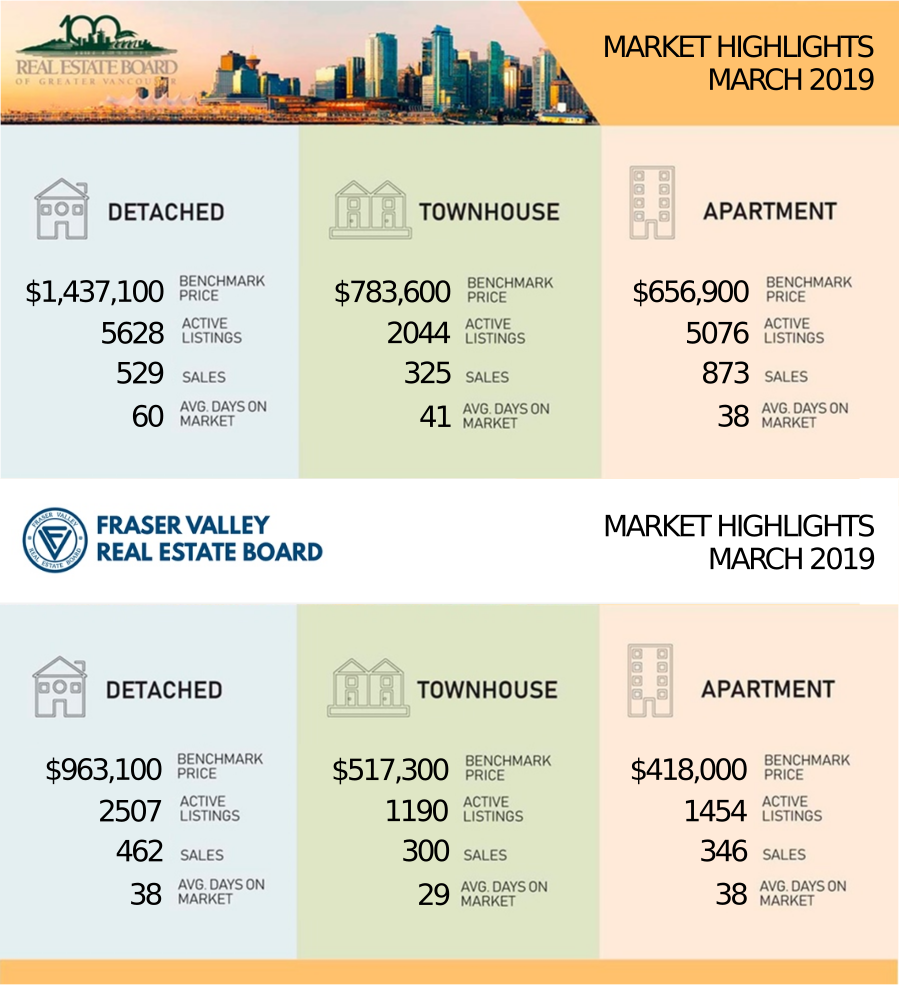
Included below are the latest statistics for real estate in the REBGV (Real Estate Board of Greater Vancouver) and FVREB (Fraser Valley Real Estate Board) areas. You will find a clickable link to each area below which will open up as a separate PDF file.
Click on the links (in blue) below for the statistics package for your area:
(The links each take a few second to open as they are files stored on my Google Drive.)
Here are the full statistic packages for Greater Vancouver and the Fraser Valley (which includes Surrey, North Surrey, South Surrey/White Rock, Cloverdale, Delta, Langley, Abbotsford, Chilliwack, and Mission.)
Below is a link to a graph showing the rise in prices in the Lower Mainland just for resale properties (no new homes) over the last year. This link is live so it will update when the new statistics come in each month. LINK to live graph
Please feel free to contact us if you would like specific information for your sub-area or if you would like a market evaluation of the value of your home.
Barry, Olga, and Alice
@media only screen and (max-width: 480px){
table#canspamBar td{font-size:14px !important;}
table#canspamBar td a{display:block !important; margin-top:10px !important;}
}