We're now into May of 2019 and, although sales are up since last month by about 6% in Greater Vancouver and just over 13% in the Fraser Valley, both areas are reporting sales well below their 10 year sales average.
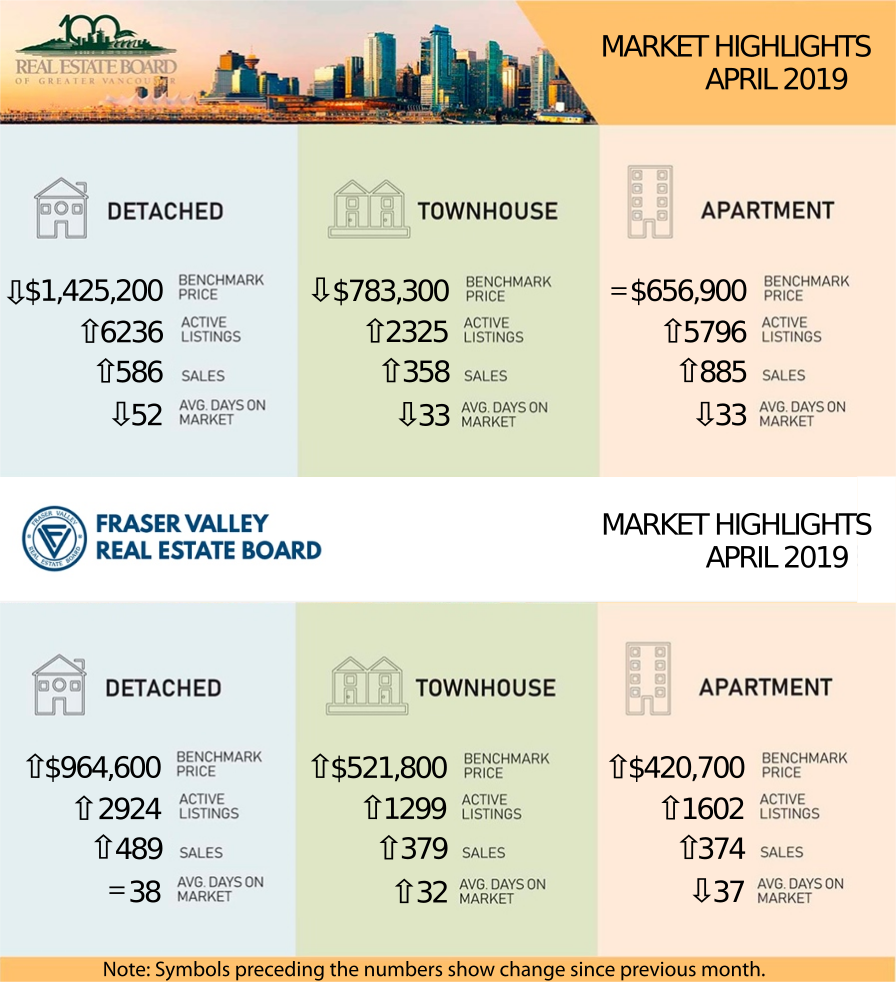
In regards to sales, the REBGV reported 1829 sales (1727 last month) whereas the Fraser Valley Board reported 1383 sales (1221 last month). These numbers are 29.1% and 19.0% respectively below last April's numbers.
The number of sales for the REBGV are 43.1% below the 10-year April sales average.
Interestingly, Toronto is seeing a re-emergence of multiple offers and rising prices again even though buyers are under the same burdensome mortgage rules as in Vancouver. Could it be that the local and Provincial governments here are more proactive in addressing the money laundering and foreign ownership problems than Ontario? Has the problem just moved eastward? Good luck to our eastern friends.
The Sales to Active ratio for the Fraser Valley continues to rise as buyers are drawn to under $1M houses and considerably less expensive condos and townhomes than across the bridges.
Generally, analysts say that downward pressure on home prices occurs when the ratio dips below the 12 per cent mark for a sustained period, while home prices often experience upward pressure when it surpasses 20 per cent over several months.
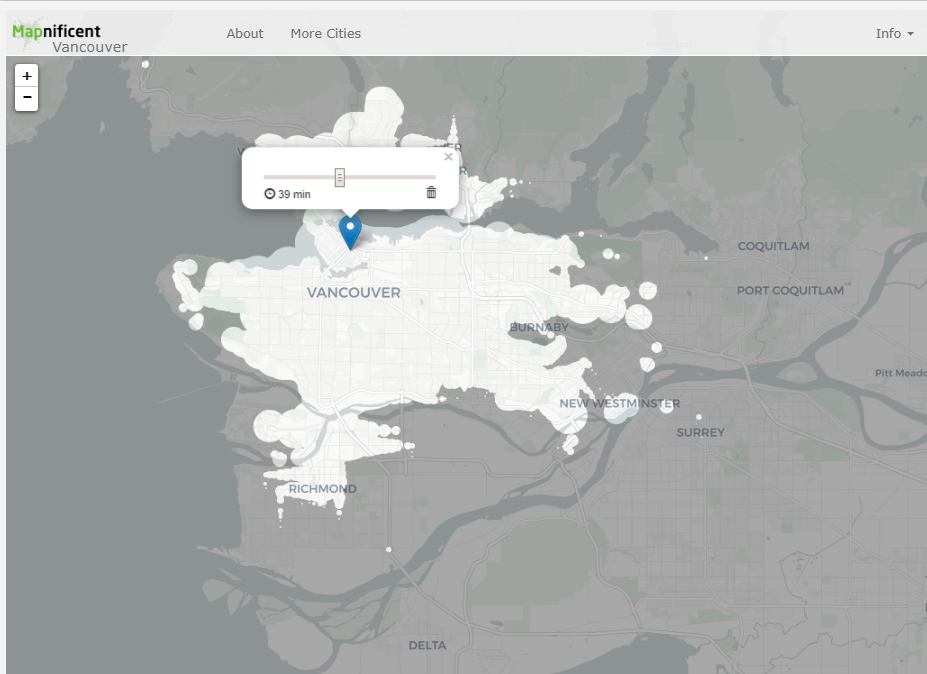
Check out this interesting tool that was created by "Mapnificent" for estimating travel time using public transit in Vancouver and the surrounding areas. Just move the blue marker to your destination and it will update automatically.
Click on the links (in blue) below for the statistics package for your area:
(The links each take a few second to open as they are files stored on my Google Drive.)
Here are the full statistic packages for Greater Vancouver and the Fraser Valley (which includes Surrey, North Surrey, South Surrey/White Rock, Cloverdale, Delta, Langley, Abbotsford, Chilliwack, and Mission.)
Below is a link to a graph showing the rise in prices in the Lower Mainland just for resale properties (no new homes) over the last year. This link is live so it will update when the new statistics come in each month. LINK to live graph
Please feel free to contact us if you would like specific information for your sub-area or if you would like a market evaluation of the value of your home.
Barry, Olga, and Alice