September of 2018 continued the trend of the last few months: July sales hit a 30 year low, August a 6 year low, and September a 10 year low. The last time that we had similar sales numbers in September was in the infamous year of 2008. Keep in mind that there are now more homes overall in the Lower Mainland than in 2008 with the high pace of building and densification over the last few years.
We are also noticing a large spike in the number of listings that have been terminated or have expired in the last few weeks. Throughout September, the average number of terminated/expired listings was about 1300 a week. In the first week of October, it has risen to 2098. This may indicate that sellers, much like many buyers, are going to take a wait-and-see attitude. The average terminated listing was removed from the market approximately halfway through the listing period, which was, on average, 148 days long.
Here are a few tables to better show what the most recent market statistics are doing.
Note that most of the numbers are going down (red): total sales, % of sales over asking, and percent of asking price. As well, the average days on the market are growing in most categories. (Numbers in blue)
As an example of reading the statistics below: for one bedroom units in Metro Vancouver, 16 of the 50 sales (32%) were at or above the asking price (98.4% of the asking price, on average) and were on the market for an average of 20 days in the last week of September.
Red numbers means the number is lower than the previous month.
Blue numbers mean that the number is higher than the previous month.
Green numbers mean that the number is the same as last month.
Metro Vancouver Attached Property Sales in the last week of September
Fraser Valley Attached Property Sales in the last week of September
Metro Vancouver Detached Property Sales in the last week of September
Fraser Valley Detached Property Sales in the last week of September
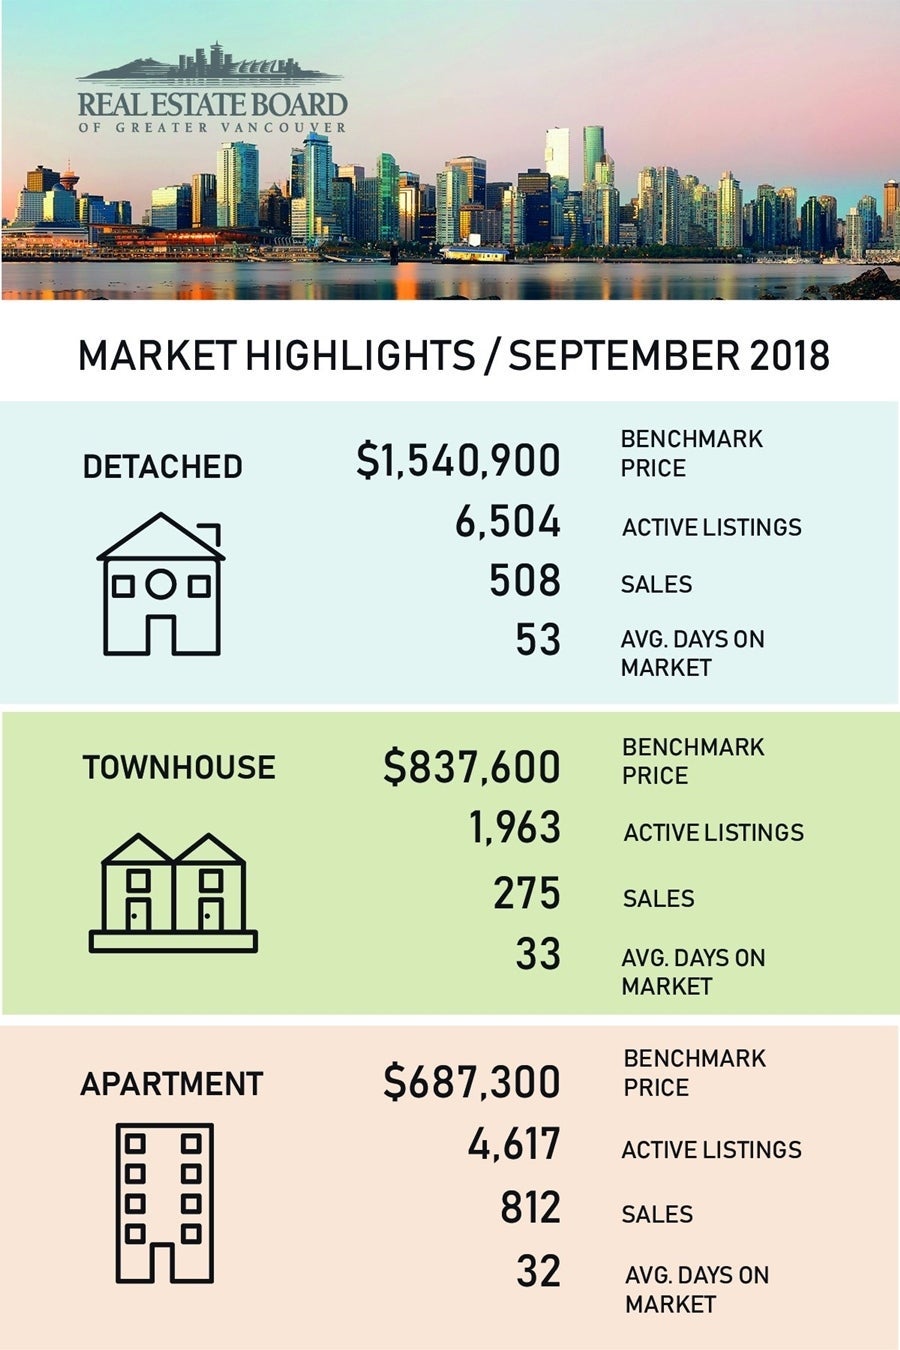
From the REBGV's September Stats: (I've added the text within the brackets)
"For all property types, the sales-to-active listings ratio for September 2018 is 12.2% (August was 16.3%, July was 17.1%, June was 20.3%, and May was 25.1%, so the trend is towards a buyer's market). By property type, the ratio is 7.8% for detached homes (August was 9.2%, July was 9.9%, June was 11.7, and May was 14.7%), 14.0% for townhomes (August was 19.4%, July was 20.2%, June was 24.9%, and May was 30.8%), and 17.6% for condominiums (August was 26.6%, July was 27.3%, June was 33.4%, and May was 41.7%).
Generally, analysts say that downward pressure on home prices occurs when the ratio dips below the 12 per cent mark for a sustained period, while home prices often experience upward pressure when it surpasses 20 per cent over several months."
The Fraser Valley Board experienced a drop of 36.1% compared to the 1,619 sales in September of 2017 and has the highest number of listings since July of 2015.
Just like last few months, September's sales-to-active ratios are all heading the right direction if you are a buyer.
Included below are the latest statistics for real estate in the REBGV (Real Estate Board of Greater Vancouver) and FVREB (Fraser Valley Real Estate Board) areas. You will find a clickable link to each area below which will open up as a separate PDF file.
Click on the links (in blue) below for the statistics package for your area:
(The links each take a few second to open as they are files stored on my Google Drive.)