Market Statistics -     May 2018


The sales for May of 2018 has continued the dip seen in the last few months. Historically, May sales are strong as it is in the end of the Spring season but this May has, like last month, experienced sales at a multi-year low.

The prices of attached homes are still rising in most areas but time spent on the market is beginning to grow on average, which is continuing the trend of the last few months.

The Fraser Valley is still seeing price appreciation in almost every subarea, especially in the condo and townhouse market. 53% of the total sales were townhouses and condos last month.

Here is an excellent article on the CBC News site that proposes that the recent government intervention is actually causing the separation in the market between the lingering briskness of the condo/townhouse market and the flagging single family home market. LINK to CBC News article. 


Here are a few tables to better show what the most recent market statistics are doing.


Note that most of the numbers are going down (red): total sales, % of sales over asking, and percent of asking price. The average days on the market are growing across the board with the exception of $2M+ homes and 2 bedroom condos in the REBGV. (Numbers in blue)

As an example of reading the statistics below:  for one bedroom units in Metro Vancouver, 31 of the 56 sales (55%) were at or above the asking price (101.2% of the asking price, on average) and were on the market for an average of 13 days in the last week of May.

Red numbers means the number is lower than the previous month.
Blue numbers mean that the number is higher than the previous month.
Green numbers mean that the number is the same as last month.

Metro Vancouver Attached Property Sales in the last week of May

# Sales
at/over Asking
Total Sales
% of Sales
at/over Asking
Type of Unit
% of
Asking Price
Avg Days
on Market
3475%Studio (0 bdrm)102.5%9
315655%1 bedroom101.2%13
448055%2 bedrooms99.6%16
618
33%
3+ bedrooms99.3%23
8415853%Total of all types100.0%24


Fraser Valley Attached Property Sales in the last week of May

# Sales
at/over Asking
Total Sales
% of Sales
at/over Asking
Type of Unit
Avg Paid
over Asking
Avg Days
on Market
00 0%Studio (0 bdrm)0.0%-
510 50%1 bedroom100.7%15
112250%2 bedrooms101.0%16
62326%3+ bedrooms99.4%24
225540%Total of all types100.1%19


Metro Vancouver Detached Property Sales in the last week of May

# Sales
at/over Asking
Total Sales
% of Sales
at/over Asking
     Sale Price of Home   
% of
Asking Price
Avg Days
on Market
020%$0 to $999,99998.8%61
73023%$1M to $1.999M96.2%35
51631%$2M and up96.0%29
324825%
Totals
96.2%34


Fraser Valley Detached Property Sales in the last week of May

# Sales
at/over Asking
Total Sales
% of Sales
at/over Asking
     Sale Price of Home   
% of
Asking Price
Avg Days
on Market
82730%$0 to $999,99999.5%26
61540%$1M to $1.999M98.3%21
1333%$2M and up99.4%3
154533%Totals99.0%23


 From the REBGV's May Stats: (I've added the text within the brackets)


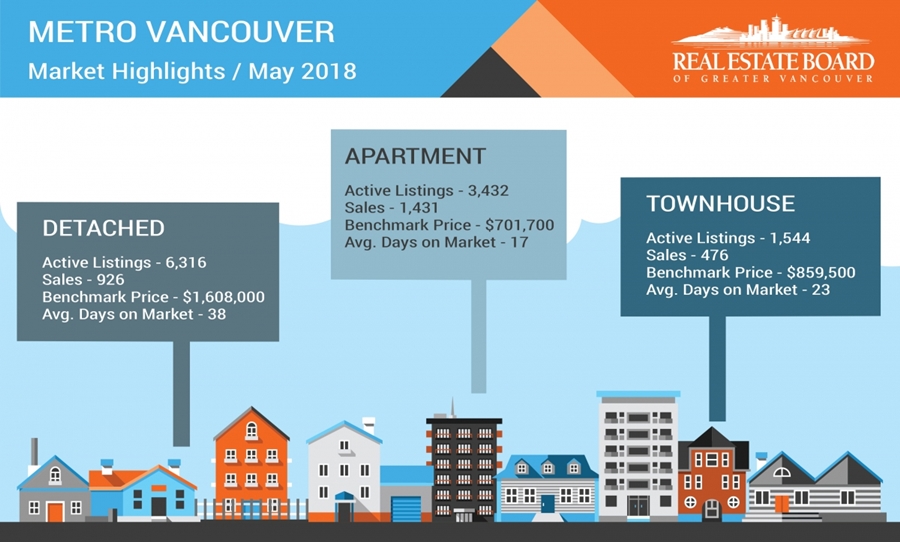
For all property types, the sales-to-active listings ratio for May 2018 is 25.1% (April was 26.3, March was 30.0%, and February was 28.2%, so last month broke the upward trend). By property type, the ratio is 14.7% for detached homes (April was 14.1%, March was 14.2%, and February was 13.0%), 30.8% for townhomes (April was 36.1%, March was 39.9%, and February was 37.6%), and 41.7% for condominiums (April was 46.7%, March was 61.6%, and February was 59.7%).


Generally, analysts say that downward pressure on home prices occurs when the ratio dips below the 12 per cent mark for a sustained period, while home prices often experience upward pressure when it surpasses 20 per cent over several months.

May's sales-to-active ratios are all heading the right direction if you are a buyer. Detached homes in particular are right on the threshold where we will start seeing downwards pressure on prices. Condos and townhomes remain in seller's market territory, although the trend has been sloping downwards over the last few months.


Included below are the latest statistics for real estate in the REBGV (Real Estate Board of Greater Vancouver) and FVREB (Fraser Valley Real Estate Board) areas. You will find a clickable link to each area below which will open up as a separate PDF file.

Click on the links (in blue) below for the statistics package for your area:

(The links each take a few second to open as they are files stored on my Google Drive.) 


BURNABY/NEW WEST  
Burnaby EastBurnaby NorthBurnaby SouthNew Westminster
    
TRI-CITIES  
CoquitlamPort CoquitlamPort Moody 
    
VANCOUVER  
Metro VancouverVancouver East 
    
NORTH SHORE  
North VancouverWest Vancouver  
    
SOUTH FRASER/RICHMOND  
LadnerTsawwassenRichmond 
    
RIDGE MEADOWS   
Pitt MeadowsMaple Ridge  
    
UP THE COAST/ISLAND  
Bowen IslandSquamishSunshine CoastWhistler
 

Here are the full statistic packages for Greater Vancouver and the Fraser Valley (which includes Surrey, North Surrey, South Surrey/White Rock, Cloverdale, Delta, Langley, Abbotsford, Chilliwack, and Mission.)

Below is a link to a graph showing the rise in prices in the Lower Mainland just for resale properties (no new homes) over the last year. This link is live so it will update when the new statistics come in each month. LINK to live graph

Please feel free to contact us if you would like specific information for your sub-area or if you would like a market evaluation of the value of your home.


Share