January 2018 was a wet but warm month in the Lower Mainland. Except for the first few days of the year where temperatures were below the historical averages, our daily temperatures have trended about 2 to 4 degrees warmer than the historical averages.
This sogginess has not affected the townhouse and condo market as we are still seeing large lineups at condo pre-sale events and multiple offer bidding on most properties, especially in the Fraser Valley.
At the moment, those people who felt like they bought at the top of the market just a few months ago can be comforted in knowing that we haven't reached a peak in pricing yet. Building condition doesn't seem to be as much of a concern to many buyers as condos of all ages are being purchased in a frenzy. In fact, some older properties are being purchased as holding properties, as developers court the strata councils of those buildings in prime building areas to persuade the owners to sell and move out.
The Fraser Valley has had an even more frenzied month of sales, dominated again by condos and townhouses (51% of the total sales) and only fell behind January of 2016 and 1992 in terms of number of sales.
All this activity is a little puzzling as the big banks are turning down 20% of the applications for mortgage loans. LINK to The Financial Post.
Here are a few tables to better show what the most recent market statistics are doing.
As an example of reading the statistics below: for one bedroom units in Metro Vancouver, 63 of the 76 sales (83%) were at or above the asking price (104.4% of the asking price, on average) and were on the market for an average of 11 days in the last week of January.
Metro Vancouver Attached Property Sales in the last week of January.
For all property types, the sales-to-active listings ratio for January 2018 is 26.2% (December was 26.0% and November was 32.0% so the trend overall is downwards). By property type, the ratio is 11.6% for detached homes (December was 14.4% and November was 15.9%), 32.8% for townhomes (December was 38.8% and November was 36.4%), and 57.2% for condominiums (December was 59.6% and November was 67.8%).
Generally, analysts say that downward pressure on home prices occurs when the ratio dips below the 12 per cent mark for a sustained period, while home prices often experience upward pressure when it surpasses 20 per cent over several months.
Included below are the latest statistics for real estate in the REBGV (Real Estate Board of Greater Vancouver) and FVREB (Fraser Valley Real Estate Board) areas. You will find a clickable link to each area below which will open up as a separate PDF file.
Click on the links (in blue) below for the statistics package for your area:
(The links each take a few second to open as they are files stored on my Google Drive.)
Here are the full statistic packages for:
Greater Vancouver
The Fraser Valley (which includes Surrey, North Surrey, South Surrey/White Rock, Cloverdale, Delta, Langley, Abbotsford, Chilliwack, and Mission.)
Below is a link to a graph showing the rise in prices in the Lower Mainland just for resale properties (no new homes) over the last year. This link is live so it will update when the new statistics come in each month. LINK to live graph
As always, please feel free to contact us if you would like specific information for your sub-area or if you would like a market evaluation of the value of your home.
Barry, Olga, and Alice
www.teamurbannest.com
Barry, Olga, and Alice
www.teamurbannest.com
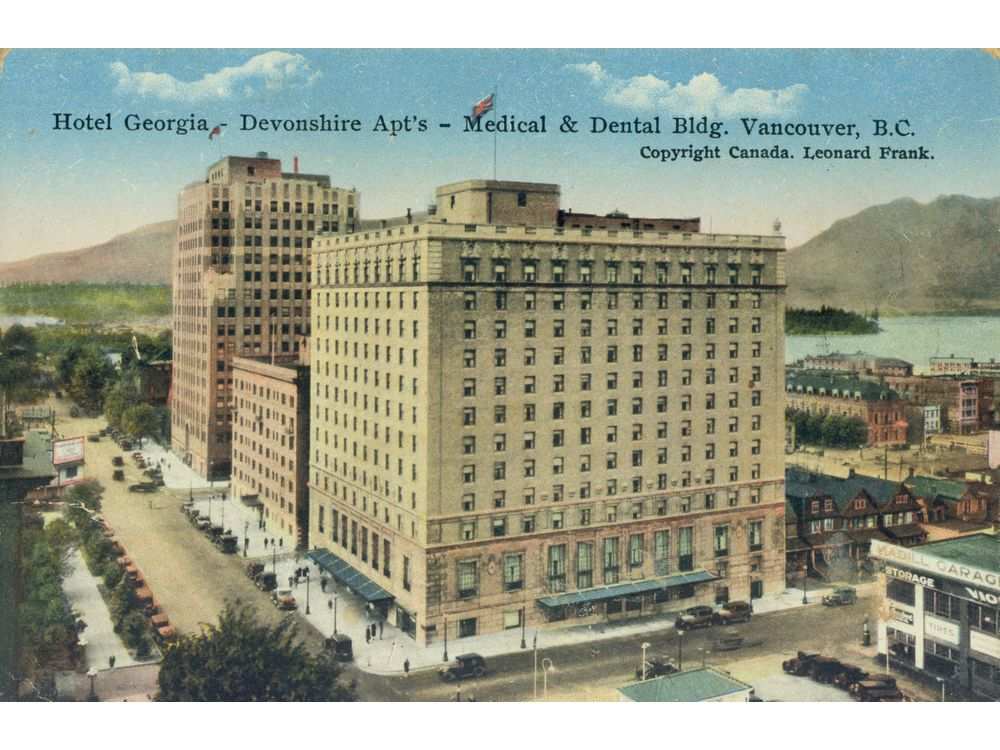
The Devonshire Hotel/Apartments
Here's an interesting article about early Vancouver originally printed in the modestly-named "Vancouver World" newspaper in 1924. By the way, this is a view of the block just across the street from the Vancouver Art Gallery on Georgia Street. The service station in the lower right hand quarter is part of the Pacific Centre Mall. Notice the houses along Seymour Street. The Devonshire is mid-block between the two taller towers. The article also mentions that the Second Narrow Bridge construction was about to begin with the budget of $1.4 million dollars.
 LINK to the Vancouver Sun article.
Enjoy!
102-403 North Road, Coquitlam, BC, V3K 3V9