The month of February has seen a turn-around in the multi-month price drops for single-family homes in many areas of the Lower Mainland. Whether it will continue remains to be seen, but anyone that purchased a house here in the last couple of years is probably taking an optimistic sigh of relief.
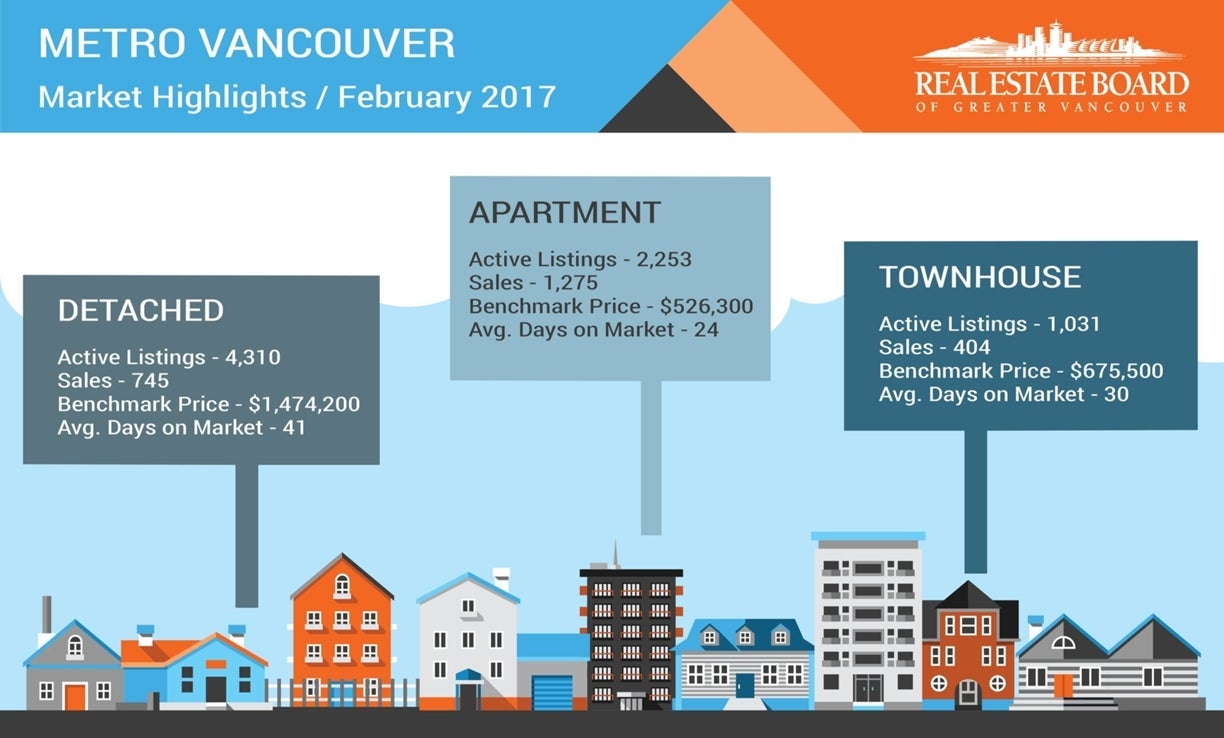
For Metro Vancouver, February had sales about 8 percent below the 10-year average but with a significantly reduced number of listings. We haven't seen a listing inventory this low since 2003.
The Fraser Valley had higher than their 10-year average sales with prices appreciating in almost all sub-areas.
My prediction for this month (which is exactly the same as last month's prediction) is that sales will increase sharply over the next few months as the pent-up demand for listings begins to grow and buyers gain confidence that the market will not be having a huge downward correction as some doomsayers have predicted.
Included below are the latest statistics for real estate in the REBGV (Real Estate Board of Greater Vancouver) and FVREB (Fraser Valley Real Estate Board) areas. You will find a clickable link to each area below which will open up as a separate PDF file.
Click on the links (in blue) below for the statistics package for your area:
(The links each take a few second to open as they are files stored on my Google Drive.)
BURNABY/NEW WEST
Burnaby East Burnaby North Burnaby South New Westminster
TRI-CITIES
Coquitlam Port Coquitlam Port Moody
VANCOUVER
Metro Vancouver Vancouver East Vancouver West
NORTH SHORE
North Vancouver West Vancouver
SOUTH FRASER/RICHMOND
Ladner Tsawwassen Richmond
RIDGE MEADOWS
Pitt Meadows Maple Ridge
UP THE COAST/ISLAND
Bowen Island Squamish Sunshine Coast Whistler
Here are the full statistic packages for:
Greater Vancouver
The Fraser Valley (which includes Surrey, North Surrey, South Surrey/White Rock, Cloverdale, Delta, Langley, Abbotsford, Chilliwack, and Mission.)
Below is a link to a graph showing the rise in prices in the Lower Mainland just for resale properties (no new homes) over the last year. This link is live so it will update when the new statistics come in each month. LINK to live graph
Please feel free to contact us if you would like specific information for your sub-area or if you would like a market evaluation of the value of your home.