With Punxsutawney Phil predicting 6 more weeks of winter, I hope everyone with a driveway or walkway appreciates how much the snow shoveling is improving their cardiovascular health.
Happy Chinese New Year! The Year of the Fire Rooster has begun.
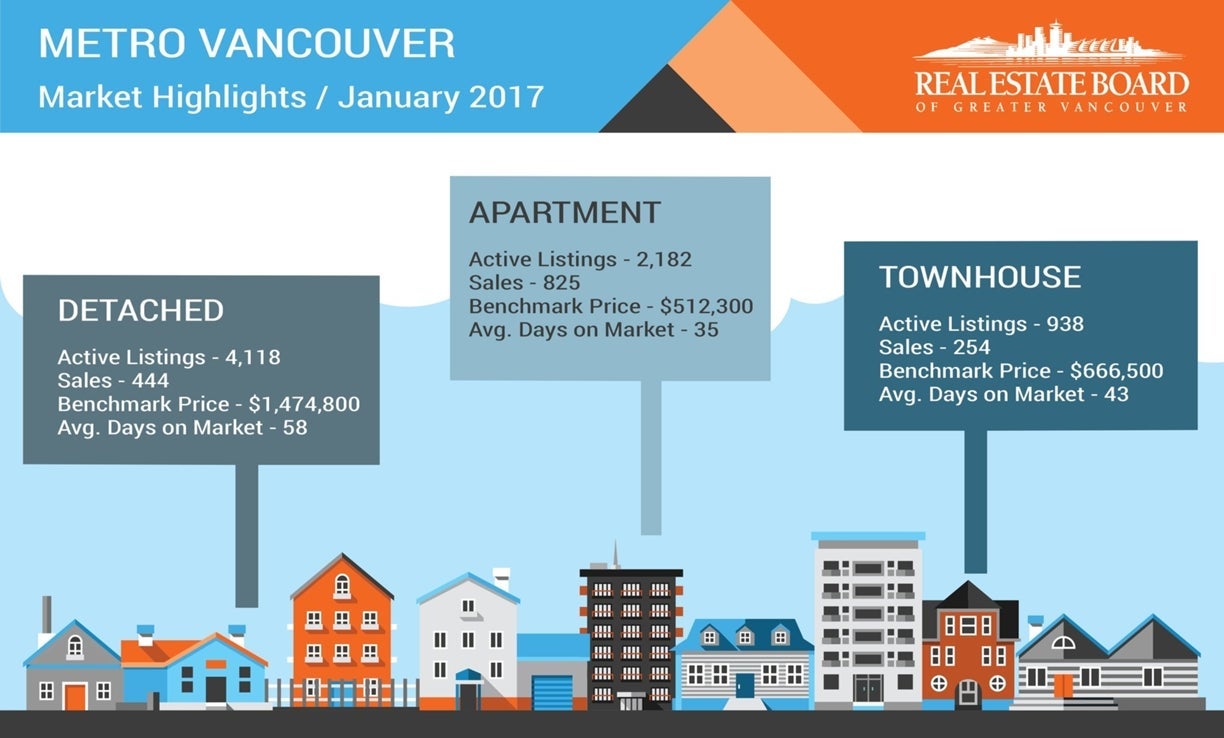
January 2017's real estate market has started with more of a whimper than a bang with sales well below the 10 year average in most areas of the Lower Mainland. The Fraser Valley is above their 10 year average but well below the record levels that they saw in January of last year.
The Provincial Government has backtracked a little on their Foreign Buyer's Tax by allowing an exemption for those with work permits. It's unknown at this time how many foreign workers in Metro Vancouver this will affect but the number of foreign workers in BC is estimated to be above 70,000 according to the BC Federation of Labour. Of course, many of them will not be purchasing homes but it is still a considerable number of potential buyers that will no longer be subject to the tax.
Like last month, the "out-of-town" areas of Whistler, Squamish, the Sunshine Coast, and Bowen Island all saw increases in value for single family homes while the biggest drops in value were seen in Tsawwassen and Ladner.
The big winners in price appreciation were townhouses and apartments throughout much of the Metro Vancouver area.
As mentioned previously, the Fraser Valley had strong sales numbers that exceeded the 10 year average for the region, with pricing up in all categories: single family, townhouses, and apartments.
My prediction for this month is that sales will increase sharply over the next few months as the pent-up demand for listings begins to grow and buyers gain confidence that the market will not be having a huge downward correction as some doom-sayers have predicted.
Included below are the latest statistics for real estate in the REBGV (Real Estate Board of Greater Vancouver) and FVREB (Fraser Valley Real Estate Board) areas. You will find a clickable link to each area below which will open up as a separate PDF file.
Click on the links (in blue) below for the statistics package for your area:
(The links each take a few seconds to open as they are files stored on my Google Drive.)
BURNABY/NEW WEST
Burnaby East Burnaby North Burnaby South New Westminster
TRI-CITIES
Coquitlam Port Coquitlam Port Moody
VANCOUVER
Metro Vancouver Vancouver East Vancouver West
NORTH SHORE
North Vancouver West Vancouver
SOUTH FRASER/RICHMOND
Ladner Tsawwassen Richmond
RIDGE MEADOWS
Pitt Meadows Maple Ridge
UP THE COAST/ISLAND
Bowen Island Squamish Sunshine Coast Whistler
Here are the full statistic packages for:
Greater Vancouver
The Fraser Valley (which includes Surrey, North Surrey, South Surrey/White Rock, Cloverdale, Delta, Langley, Abbotsford, Chilliwack, and Mission.)
Below is a link to a graph showing the rise in prices in the Lower Mainland just for resale properties (no new homes) over the last year. This link is live so it will update when the new statistics come in each month.
LINK to live graph
Please feel free to contact us if you would like specific information for your sub-area or if you would like a market evaluation of the value of your home.
Please feel free to contact us if you would like specific information for your sub-area or if you would like a market evaluation of the value of your home.