September is typically a busy month for the average homeowner.
Kids go back to school. Work demands may increase at many businesses as they ramp up activity after the summer break. Major home renovation projects are in the midst of wrapping up, and smaller projects may be about to start.
If there’s anything we can do to help with questions, contractor referrals, advice, or information related to real estate, give us a call or send us a quick email.
In fact, that’s one of the reasons that we stay in touch with you on a regular basis. We would like to continually remind you that our services don’t end once we’ve helped you buy or sell a home. In the months and years in between transactions, we're dedicated to helping you enjoy your home and understand your real estate options.
So, if you need help or advice, get in touch with us. That’s why we're here!
And....on to the statistics.
August of 2019 brought the Lower Mainland real estate market a little closer to the 10 year sales average. Greater Vancouver's sales were 9.2% below and the Fraser Valley was "slightly" below. (No number was given.)
We are into the first week of September and here are some of the highlights:
There have been some multiple offers on some well-priced and well-presented homes although the sale prices have been very close to the asking price and not always above as in years past.
Open Houses are becoming well attended again.
Interest rates are remaining flat. The best rate that I've found is 2.37% for a 5 year fixed mortgage under fairly restrictive circumstances.
The First Time Home Buyer Incentive is now active which is where you can apply for a 5-10% shared equity mortgage with the Government of Canada. More information HERE
The Bank of Canada (BoC) has kept their lending rate at 1.75% but we expect a further rate cut before the end of the year.
Here is a link to a Landcor Report for the first half of 2019: LINK
Landcor is a real estate data company that was founded in 1988 and has created a fast and accurate system for analyzing properties based on the sold data from Real Estate boards across British Columbia. If you would like a Landcor Report on your property, let us know!
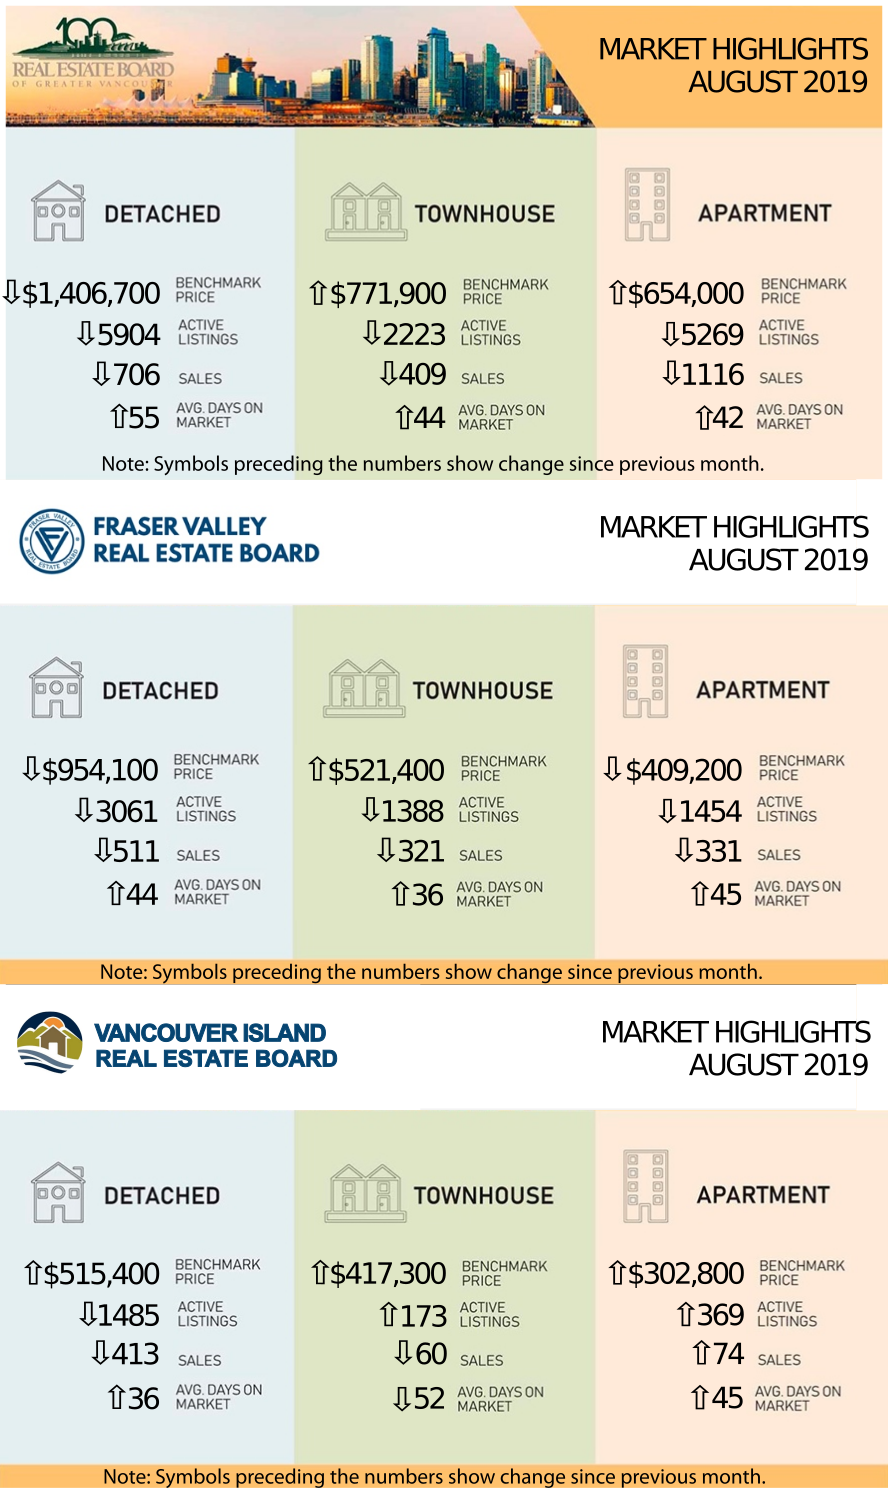
From the REBGV August Statistics:
"The Real Estate Board of Greater Vancouver (REBGV) reports that residential home sales in the region totaled 2,231 in August 2019, a 15.7 per cent increase from the 1,929 sales recorded in August 2018, and a 12.7 per cent decrease from the 2,557 homes sold in July 2019.
Last month’s sales were 9.2 per cent below the 10-year August sales average. ."
From the Fraser Valley Board's August Statistics:
"The Fraser Valley Real Estate Board processed 1,297 sales of all property types on its Multiple Listing Service® (MLS®) in August, an 11 per cent decrease compared to sales in July 2019, and a 12.3 per cent increase compared to the 1,155 sales in August of last year."
The Sales to Active ratios for Greater Vancouver and Fraser Valley Boards are still in the range where there isn't significant upward or downward pressure on prices.
Generally, analysts say that downward pressure on home prices occurs when the ratio dips below the 12 per cent mark for a sustained period, while home prices often experience upward pressure when it surpasses 20 per cent over several months.
Click on the links (in blue) below for the statistics package for your area:
(The links each take a few second to open as they are files stored on my Google Drive.)
August of 2019 brought the Lower Mainland real estate market a little closer to the 10 year sales average. Greater Vancouver's sales were 9.2% below and the Fraser Valley was "slightly" below. (No number was given.)
We are into the first week of September and here are some of the highlights:
There have been some multiple offers on some well-priced and well-presented homes although the sale prices have been very close to the asking price and not always above as in years past.
Open Houses are becoming well attended again.
Interest rates are remaining flat. The best rate that I've found is 2.37% for a 5 year fixed mortgage under fairly restrictive circumstances.
The First Time Home Buyer Incentive is now active which is where you can apply for a 5-10% shared equity mortgage with the Government of Canada. More information HERE
The Bank of Canada (BoC) has kept their lending rate at 1.75% but we expect a further rate cut before the end of the year.
Here is a link to a Landcor Report for the first half of 2019: LINK
Landcor is a real estate data company that was founded in 1988 and has created a fast and accurate system for analyzing properties based on the sold data from Real Estate boards across British Columbia. If you would like a Landcor Report on your property, let us know!
From the REBGV August Statistics:
"The Real Estate Board of Greater Vancouver (REBGV) reports that residential home sales in the region totaled 2,231 in August 2019, a 15.7 per cent increase from the 1,929 sales recorded in August 2018, and a 12.7 per cent decrease from the 2,557 homes sold in July 2019.
Last month’s sales were 9.2 per cent below the 10-year August sales average. ."
From the Fraser Valley Board's August Statistics:
"The Fraser Valley Real Estate Board processed 1,297 sales of all property types on its Multiple Listing Service® (MLS®) in August, an 11 per cent decrease compared to sales in July 2019, and a 12.3 per cent increase compared to the 1,155 sales in August of last year."
The Sales to Active ratios for Greater Vancouver and Fraser Valley Boards are still in the range where there isn't significant upward or downward pressure on prices.
Generally, analysts say that downward pressure on home prices occurs when the ratio dips below the 12 per cent mark for a sustained period, while home prices often experience upward pressure when it surpasses 20 per cent over several months.
Click on the links (in blue) below for the statistics package for your area:
(The links each take a few second to open as they are files stored on my Google Drive.)
| BURNABY/NEW WEST | |||
| Burnaby East | Burnaby North | Burnaby South | New Westminster |
| TRI-CITIES | |||
| Coquitlam | Port Coquitlam | Port Moody | |
| VANCOUVER | |||
| Metro Vancouver | Vancouver East | ||
| NORTH SHORE | |||
| North Vancouver | West Vancouver | ||
| SOUTH FRASER/RICHMOND | |||
| Ladner | Tsawwassen | Richmond | |
| RIDGE MEADOWS | |||
| Pitt Meadows | Maple Ridge | ||
| UP THE COAST/ISLAND | |||
| Bowen Island | Squamish | Sunshine Coast | Whistler |
Here are the full statistic packages for Greater Vancouver, the Fraser Valley (which includes Surrey, North Surrey, South Surrey/White Rock, Cloverdale, Delta, Langley, Abbotsford, Chilliwack, and Mission), and Vancouver Island (which includes Campbell River, Comox, Duncan, Nanaimo, Parksville/Qualicum, and Port Alberni.)
Below is a link to a graph showing the rise in prices in the Lower Mainland just for resale properties (no new homes) over the last year. This link is live so it will update when the new statistics come in each month. LINK to live graph
Below is a link to a graph showing the rise in prices in the Lower Mainland just for resale properties (no new homes) over the last year. This link is live so it will update when the new statistics come in each month. LINK to live graph
Featured Video of the Month:
I hope that those that decide to grow cannabis in their home are aware and will take the precautions that this video raises. Who knew that growing plants was such a complicated procedure? (Click to view the Youtube video in a new window.)
There are certain legal and accounting issues that arise when a "non-resident" of Canada acquires or sells property in Canada.
These issues are set out below.
Non-Resident Sellers
The Income Tax Act of Canada provides that whenever a non-resident disposes of property, the non-resident is required to pay the appropriate amount of taxes on any gain. In order to satisfy the Buyer that the appropriate amount of taxes are paid, the Seller must provide to the purchaser, on or before closing, a clearance certificate from Revenue Canada. This certificate is issued by the federal government and certifies that a certain amount of money is payable for the taxes. The amount owing is deducted from the sale proceeds and sent directly to the federal government by the Seller’s lawyer.
The clearance certificate is issued pursuant to section 116 of the Income Tax Act and is usually required on the closing date. The application for the certificate may be made prior to closing by the Seller, but not until there has been a subject free contract of purchase and sale. The wait for the clearance certificate is usually around 3 months, so in a perfect world, there would be a 3-month lead-time between subject removal and the completion date.
Complications can arise if the certificate is not obtained prior to the closing date. In such a case, the Buyer is required to hold back from the sale proceeds a percentage of the selling price. This percentage is between 25% and 50%, depending on whether the property is non-depreciable property (a residence of the Seller), depreciable property (the property has been rented), or inventory (Seller is a builder). The transaction closes with the money remaining in a lawyer’s trust account until the certificate is obtained. Once the certificate is obtained, the taxes are paid from the holdback and the Seller receives any amount left over.
Note that the holdback is based on the selling price, not the equity in the property. If there is financing on the property, the Seller may need to pay this financing from other sources.
Article provided by bcrealestatelawyers.com
Please feel free to contact us if you would like specific information for your neighborhood, would like to be set up on a search to keep track of your local market, or if you would like a market evaluation of the value of your home.