July of 2018 has continued the trend of the last few months. Last month there were only 2037 sales of all types in the REBGV, which is 30.9% lower than July of last year, and 1290 sales in the FVREB (Fraser Valley Board), which is 33.4% lower than last year. At the same time, listings are over 30% higher than the same period last year, with days on the market rising substantially.
For the Fraser Valley, in contrast to the preceding months, we are now seeing price drops in the townhouse and condo markets in almost every subarea. You'll remember that last month about 2/3 of the Fraser Valley subareas were still seeing price appreciation. This month, only 1/3 are seeing marginal price hikes.
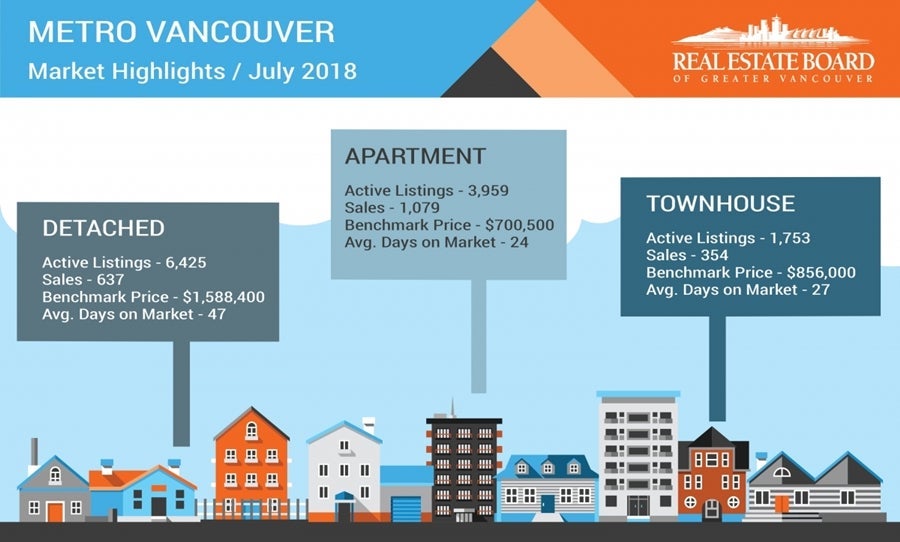
From the REBGV's July Stats: (I've added the text within the brackets)
For all property types, the sales-to-active listings ratio for July 2018 is 17.1% (Jun was 20.3%, May was 25.1%, and April was 26.3%, so the trend continues towards a buyer's market). By property type, the ratio is 9.9% for detached homes (June was 11.7%, May was 14.7%, and April was 14.1%), 20.2% for townhomes (June was 24.9%, May was 30.8%, and April was 36.1%), and 27.3% for condominiums (June was 33.4%, May was 41.7%, and April was 46.7%).
Generally, analysts say that downward pressure on home prices occurs when the ratio dips below the 12 per cent mark for a sustained period, while home prices often experience upward pressure when it surpasses 20 per cent over several months.
The Fraser Valley Real Estate Board reports a 17.0% sales-to-active ratio for all property types for July 2018.
Just like last month, July's sales-to-active ratios are all heading the right direction if you are a buyer.
Included below are the latest statistics for real estate in the REBGV (Real Estate Board of Greater Vancouver) and FVREB (Fraser Valley Real Estate Board) areas. You will find a clickable link to each area below which will open up as a separate PDF file.
Click on the links (in blue) below for the statistics package for your area:
(The links each take a few second to open as they are files stored on my Google Drive.)
Click on the links (in blue) below for the statistics package for your area:
(The links each take a few second to open as they are files stored on my Google Drive.)
Here are the full statistic packages for Greater Vancouver and the Fraser Valley (which includes Surrey, North Surrey, South Surrey/White Rock, Cloverdale, Delta, Langley, Abbotsford, Chilliwack, and Mission.)
Below is a link to a graph showing the rise in prices in the Lower Mainland just for resale properties (no new homes) over the last year. This link is live so it will update when the new statistics come in each month. LINK to live graph
Please feel free to contact us if you would like specific information for your sub-area or if you would like a market evaluation of the value of your home.