We hope that everyone is well and staying safe. With a little luck and a lot of vaccinations, we are hopeful that the worst days are behind us. It's hard not to feel optimistic once the weather turns bright and sunny.
MARCH HOME SALES AND NEW LISTINGS SET RECORDS IN METRO VANCOUVER
Homebuyer and seller activity reached unprecedented levels across Metro Vancouver in March.
Residential home sales in the region totalled 5,708 in March 2021, a 126% increase from sales recorded in March 2020, and a 53% increase from sales in February 2021.
Last month’s sales were 72% above the 10-year March sales average and is the highest monthly sales total ever recorded in the region.
"In March, residents bought and listed homes across our region at levels not seen before. This surge in activity is increasing upward pressure on prices. We’re beginning to see double-digit price gains for single-family homes and townhomes over the last 12 months."
Taylor Biggar, REBGV Chair.
Demand was most pronounced in rural and suburban areas. Delta – South saw a 196% increase in sales over 2020 – the largest increase in Metro Vancouver. This was followed by Whistler, which experienced a 195% increase, and Squamish, which saw a 189% increase in sales.
“While we did see a record number of listings enter the market last month, the demand in today’s market isn’t allowing that new supply to accumulate. As a result, the overall inventory of homes for sale decreased compared to last year,” said Biggar.
For all property types, the sales-to-active listings ratio for March 2021 is 62%. By property type, the ratio is 53% for detached homes, 80% for townhomes, and 65% for apartments.
Generally, analysts say downward pressure on home prices occurs when the ratio dips below 12% for a sustained period, while home prices often experience upward pressure when it surpasses 20% over several months.
“Today’s activity can be attributed, in part, to an economy that’s showing signs of recovery, historically low-interest rates, high demand for space, and increased household savings,” Biggar said.
The MLS® Home Price Index composite benchmark price for all residential properties in Metro Vancouver is $1,123,300. This is a 9.4% increase over March 2020 and a 3.6% increase compared to February 2021.
LINK to the February 2021 REBGV statistics.
MARCH SHATTERS MONTHLY SALES AND NEW LISTINGS RECORDS IN THE FRASER VALLEY
MARCH SHATTERS MONTHLY SALES AND NEW LISTINGS RECORDS IN THE FRASER VALLEY
Fraser Valley real estate hit two historical highs in March, setting records for both sales and new listings processed in one month since the Fraser Valley Real Estate Board’s (FVREB) inception in 1921.
In March, the FVREB processed 3,329 residential and commercial sales on its Multiple Listing Service® (MLS®), an increase of 131% compared to March 2020 and 18% more than were processed in February. The previous record of 3,006 sales was set in March of 2016.
Larry Anderson, President of the Board, said of this month’s statistics, “This market is uncharted territory for Fraser Valley real estate. The surprising strength of the economy, the influence of the pandemic and a lack of inventory of all property types have created unprecedented demand for housing in our region.
“It is very stressful for buyers. REALTORS® are working hard to guide them through what has become a protracted, powerful seller’s market. As we continue to help our clients grapple with escalating prices and multiple offers, March did bring some good news. It set a record for volume of new listings received improving selection,” said Anderson.
LINK to the February 2021 FVREB statistics.
INVENTORY UP SLIGHTLY BUT STILL NO RELIEF FOR BUYERS
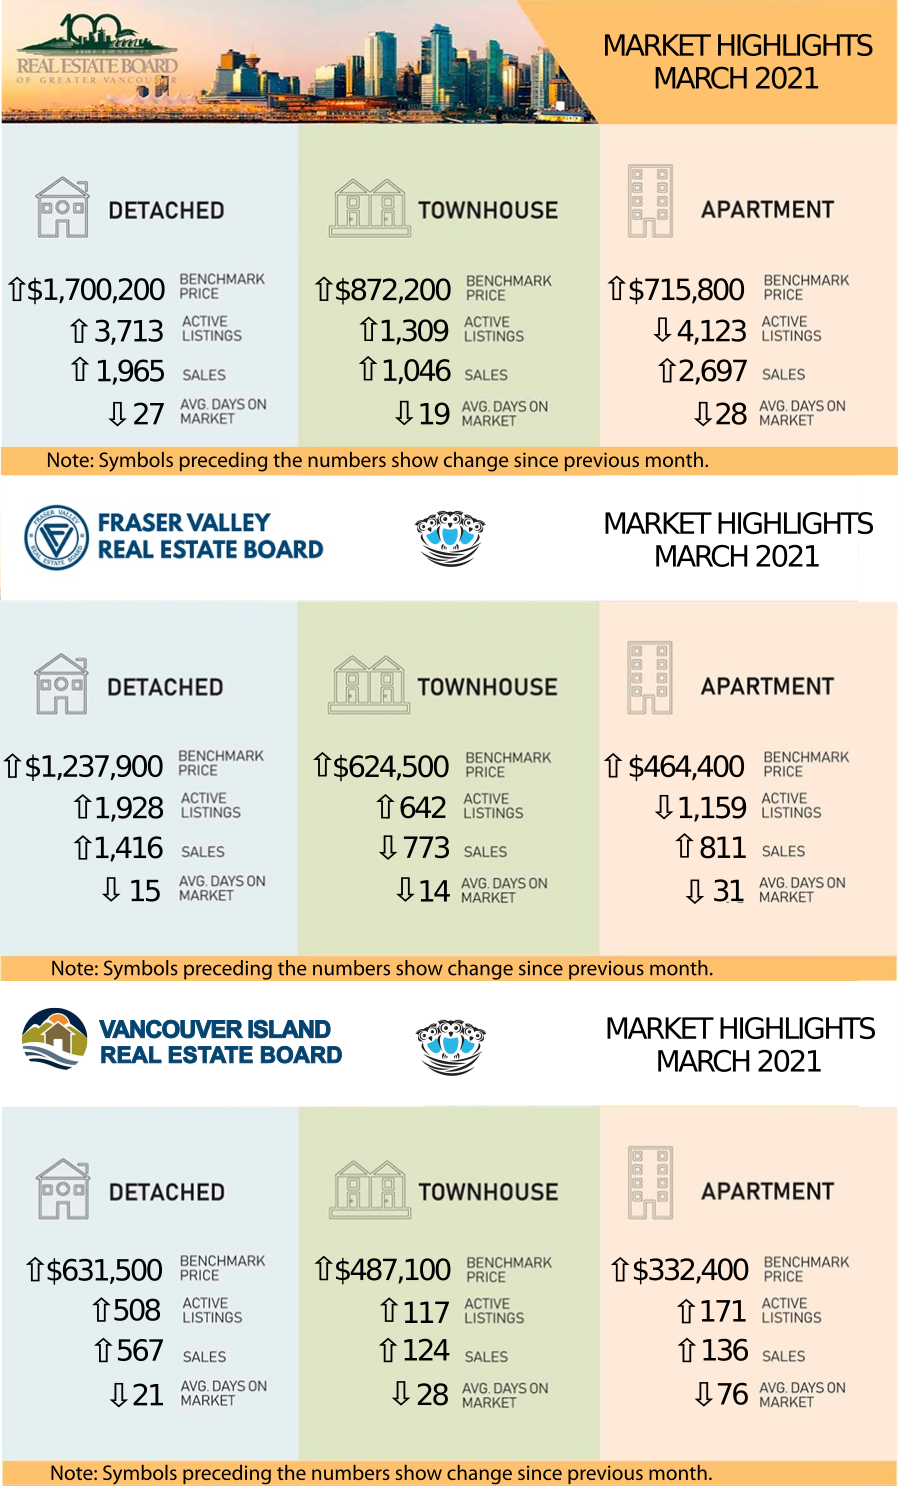
While active listings in March were higher than in February, inventory is still at a historical low. There were 508 single-family detached properties for sale last month compared to 394 in February, an increase of 29%. Month-over-month townhouse inventory increased by 29%, with 117 units for sale in March compared to 91 in February. The number of condo apartments for sale rose slightly, up to 171 from 169 in February.
"Although lack of inventory is a problem throughout British Columbia, it has reached a crisis point on Vancouver Island," says 2021 VIREB president Ian Mackay. “Demand-side policies like taxes and higher mortgage rates have done little to remedy our inventory issue, which is a decade-old problem,” says Mackay. “Vancouver Island has always been popular with retirees, but COVID-19 and the option of remote work are now attracting younger buyers. Competition is fierce, and we don’t see that abating any time soon.”
The British Columbia Real Estate Association (BCREA) does not see the inventory situation improving until more supply comes online later in the year. BCREA and local real estate boards are advocating with policymakers at the provincial and regional levels to speed up the development process so that municipalities can expand supply more quickly to meet demand.
“It’s painfully clear that attempts to dampen demand have not moderated home prices, so the best route to making housing more affordable, particularly for first-time buyers, is to increase supply,” says Mackay. “It’s not a quick solution, but it’s the only one that makes sense long-term. And, to do that, we need all levels of government working together.”
INVENTORY UP SLIGHTLY BUT STILL NO RELIEF FOR BUYERS
While active listings in March were higher than in February, inventory is still at a historical low. There were 508 single-family detached properties for sale last month compared to 394 in February, an increase of 29%. Month-over-month townhouse inventory increased by 29%, with 117 units for sale in March compared to 91 in February. The number of condo apartments for sale rose slightly, up to 171 from 169 in February.
"Although lack of inventory is a problem throughout British Columbia, it has reached a crisis point on Vancouver Island," says 2021 VIREB president Ian Mackay. “Demand-side policies like taxes and higher mortgage rates have done little to remedy our inventory issue, which is a decade-old problem,” says Mackay. “Vancouver Island has always been popular with retirees, but COVID-19 and the option of remote work are now attracting younger buyers. Competition is fierce, and we don’t see that abating any time soon.”
The British Columbia Real Estate Association (BCREA) does not see the inventory situation improving until more supply comes online later in the year. BCREA and local real estate boards are advocating with policymakers at the provincial and regional levels to speed up the development process so that municipalities can expand supply more quickly to meet demand.
“It’s painfully clear that attempts to dampen demand have not moderated home prices, so the best route to making housing more affordable, particularly for first-time buyers, is to increase supply,” says Mackay. “It’s not a quick solution, but it’s the only one that makes sense long-term. And, to do that, we need all levels of government working together.”
LINK to the March 2021 VIREB statistics.
STATS CENTRE REPORTS
The Stats Centre Reports for the REBGV for March are available now on our website at this link under the "BLOG AND STATS" heading. They are automatically updated every month on our website as they become available. LINK
Note that you may have to refresh the screen a few times until all the reports come up. This is a problem with the Real Estate Board website.
Below is a link to a graph showing the rise in prices in the Lower Mainland just for resale properties (no new homes) over the last year. This link is live so it will update when the new statistics come in each month. LINK to live graph
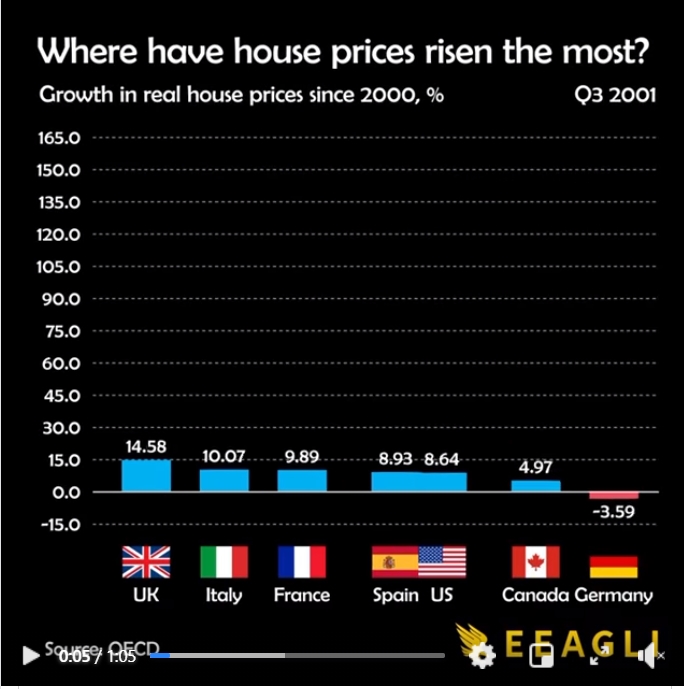
WHERE HAVE HOUSE PRICES RISEN THE MOST IN THE LAST 20 YEARS?