# Sales at/over Asking | Total Sales | % of Sales at/over Asking | Type of Unit | % of Asking Price | Avg Days on Market |
| 5 | 6 | 83% | Studio (0 bdrm) | 105.4% | 7 |
| 82 | 118 | 69% | 1 bedroom | 102.7% | 12 |
| 75 | 140 | 54% | 2 bedrooms | 100.5% | 14 |
| 24 | 50 | 48% | 3+ bedrooms | 99.6% | 21 |
| 186 | 314 | 59% | Total of all types | 101.0% | 14 |
Fraser Valley Attached Property Sales in the last week of April
# Sales at/over Asking | Total Sales | % of Sales at/over Asking | Type of Unit | Avg Paid over Asking | Avg Days on Market |
| 2 | 4 | 50% | Studio (0 bdrm) | 99.5% | 11 |
| 20 | 27 | 74% | 1 bedroom | 102.8% | 11 |
| 48 | 69 | 55% | 2 bedrooms | 101.0% | 13 |
| 19 | 32 | 56% | 3+ bedrooms | 100.1% | 18 |
| 80 | 136 | 59% | Total of all types | 100.9% | 14 |
Metro Vancouver Detached Property Sales in the last week of April
# Sales at/over Asking | Total Sales | % of Sales at/over Asking | Sale Price | % of Asking Price | Avg Days on Market |
| 9 | 14 | 64% | $0 to $999,999 | 99.6% | 12 |
| 16 | 58 | 28% | $1M to $1.999M | 98.4% | 24 |
| 7 | 36 | 19% | $2M and up | 91.1% | 34 |
| 32 | 108 | 30% | Totals | 94.0% | 26 |
Fraser Valley Detached Property Sales in the last week of April
# Sales at/over Asking | Total Sales | % of Sales at/over Asking | Sale Price | % of Asking Price | Avg Days on Market |
| 24 | 58 | 41% | $0 to $999,999 | 99.7% | 14 |
| 9 | 21 | 43% | $1M to $1.999M | 98.5% | 18 |
| 0 | 2 | 0% | $2M and up | 94.5% | 26 |
| 33 | 81 | 41% | Totals | 98.9% | 15 |
From the REBGV's April Stats: (I've added the text within the brackets)
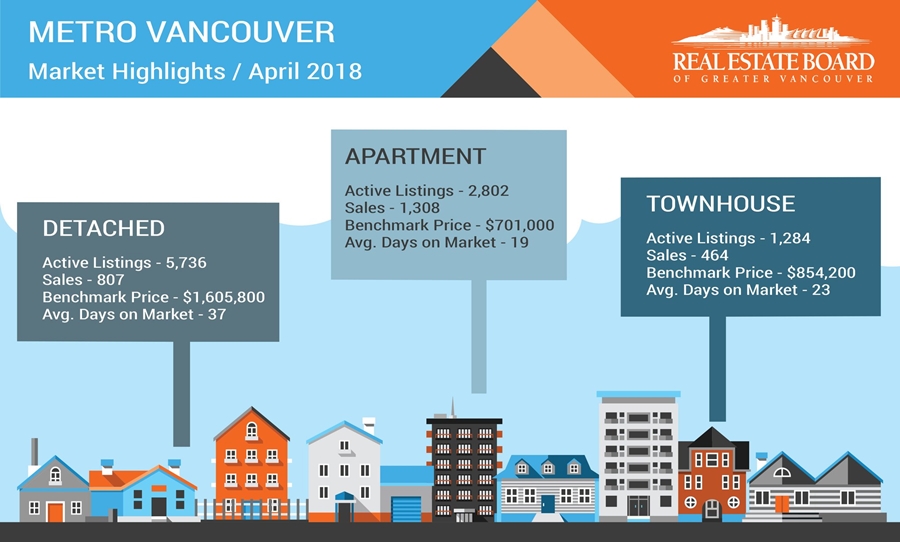
For all property types, the sales-to-active listings ratio for April 2018 is 26.3% (March was 30.0%, February was 28.2%, and January was 26.2%, so last month broke the upward trend). By property type, the ratio is 14.1% for detached homes (March was 14.2%, February was 13.0%, and January was 11.6%), 36.1% for townhomes (March was 39.9%, February was 37.6%, and January was 32.8%), and 46.7% for condominiums (March was 61.6%, February was 59.7%, and January was 57.2%).
Generally, analysts say that downward pressure on home prices occurs when the ratio dips below the 12 per cent mark for a sustained period, while home prices often experience upward pressure when it surpasses 20 per cent over several months.
So, April's sales-to-active ratio for all property types for the REBGV have finally reversed the trend towards a stronger Seller's Market. This will benefit buyers over the next few months as there should be less competition for attached properties as there is already with detached homes.
Included below are the latest statistics for real estate in the REBGV (Real Estate Board of Greater Vancouver) and FVREB (Fraser Valley Real Estate Board) areas. You will find a clickable link to each area below which will open up as a separate PDF file.
Click on the links (in blue) below for the statistics package for your area:
(The links each take a few second to open as they are files stored on my Google Drive.)
Here are the full statistic packages for: Greater Vancouver The Fraser Valley (which includes Surrey, North Surrey, South Surrey/White Rock, Cloverdale, Delta, Langley, Abbotsford, Chilliwack, and Mission.) Below is a link to a graph showing the rise in prices in the Lower Mainland just for resale properties (no new homes) over the last year. This link is live so it will update when the new statistics come in each month. LINK to live graph Please feel free to contact us if you would like specific information for your sub-area or if you would like a market evaluation of the value of your home.
|